Five Color Infographic Template – Communicate Business Vision and Core Values
RJ0200009_20
- Last Update 03/30/2025
- File Size 4.5MB
- # of Slides 2
- File Format PPTX
- Slide Ratio 16:9
- Color
Keywords
- #Content-Based Slides
- #Design-Based Slides
- #Company Introduction
- #Business Vision and Strategy
- #Diagram
- #Core Values, Vision, and Mission
- #Business Vision
- #Cluster
- #Inclusive Cluster Diagram
- #16:9
- #Venn diagram PowerPoint
- #3-circle cluster diagram
- #infographic slide template
- #intersection diagram
- #business vision presentation
- #core values visualization
About the Product
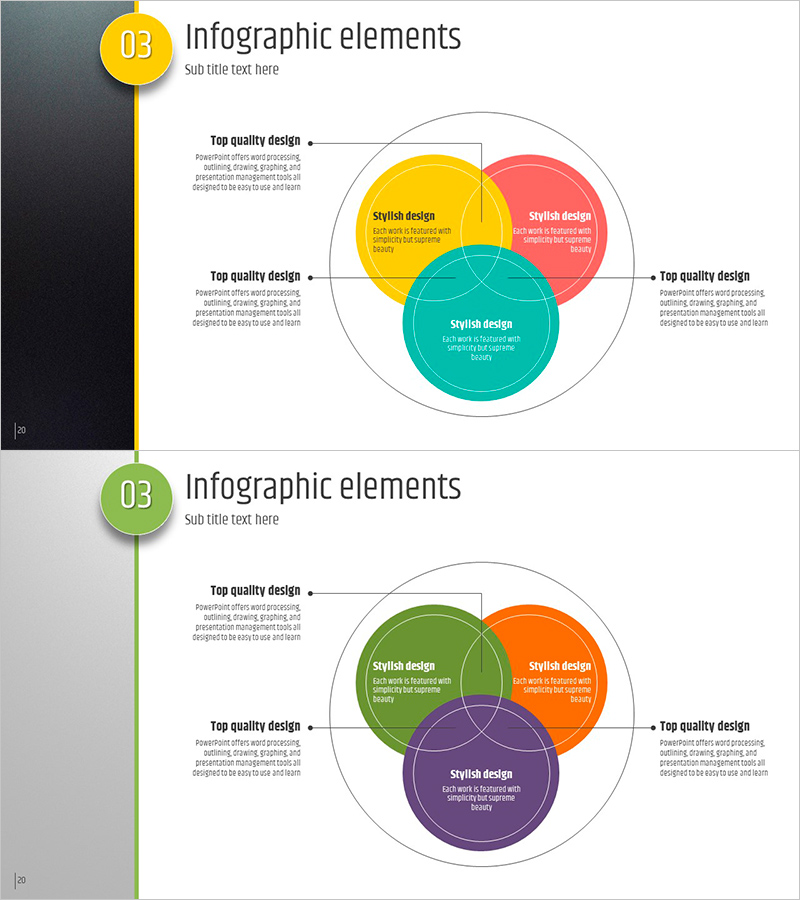
A Venn diagram-based infographic PowerPoint slide featuring three overlapping circular elements that emphasize intersection areas. The design combines five colors—yellow, red, teal, purple, and orange—creating a cohesive palette with text input spaces within each circle and intersection zone. This slide template is ideal for visually expressing relationships and commonalities among three concepts such as business vision, core values, and strategic objectives. The 2-slide set offers two layout versions with different color combinations, enabling immediate application across diverse presentation contexts.
Usage Points
-
Main Usage
This Venn diagram infographic expresses relationships, commonalities, and intersections among three concepts at a glance. It effectively communicates integrated messages when connecting organizational core elements such as business vision, core values, and management strategy. Ideal for consulting reports, executive briefings, and strategic presentations to simplify and clarify complex concepts.
-
How to Use
Input text into each circular area and intersection section to explain concept relationships. Maintain the existing color scheme or customize with organizational brand colors. Select from two layout versions with different background colors and color combinations to match your presentation context.
-
Recommended For
Recommended for executives, strategy managers, consultants, and marketing planners explaining organizational vision, values, and strategy in an integrated manner. Useful in business plans, management reports, organizational restructuring presentations, and marketing strategy development to clearly convey mutual relationships among core concepts.
-
Slide Structure
Three circular elements overlap at the center in a Venn diagram structure. Each circle represents an independent concept, while intersection areas emphasize commonalities. The design uses five colors—yellow, red, teal as primary colors and purple, orange as secondary colors—with text input areas positioned within each circle and intersection zone.
Related Products
-

Startup Goals and Vision Cluster Diagram
#Company Introduction #Business Vision and Strategy #Diagram
-

Vision & Goal Setting Diagram – Key to Business Vision and Strategy
#Company Introduction #Business Vision and Strategy #Diagram
-

Vision & Goal Square Inclusion Diagram – Strategic Business Vision Representation
#Company Introduction #Business Vision and Strategy #Diagram
-

Brand Mission and Goals Execution Plan Diagram – Foundation for Vision Realization
#Company Introduction #Business Vision and Strategy #Diagram
