Delivering Business Vision with Square Inclusion Diagram
RM0400010_14
- Last Update 02/17/2025
- File Size 0.7MB
- # of Slides 2
- File Format PPTX
- Slide Ratio 16:9
- Color
Keywords
- #Content-Based Slides
- #Design-Based Slides
- #Company Introduction
- #Business Vision and Strategy
- #Diagram
- #Core Values, Vision, and Mission
- #Business Vision
- #Cluster
- #Inclusive Cluster Diagram
- #16:9
- #nested diagram PowerPoint
- #square diagram slide
- #3-level hierarchy template
- #business vision diagram
- #inclusion diagram PowerPoint slide
About the Product
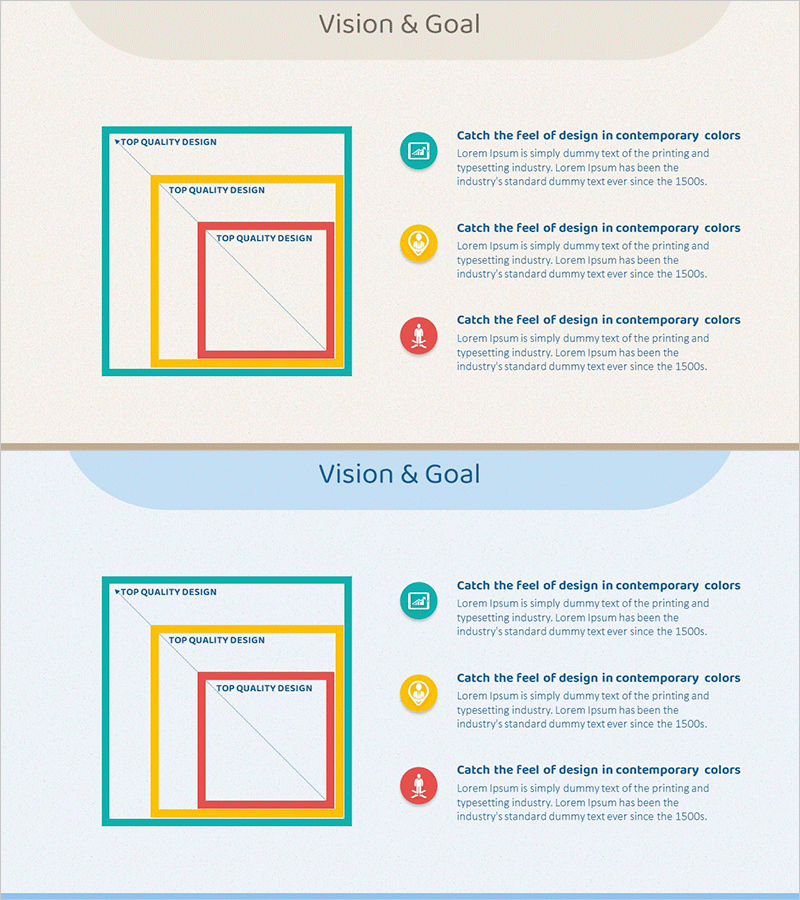
A 3-level nested square diagram PowerPoint slide designed to communicate business vision and strategic goals through a hierarchical structure. The contrasting teal, yellow, and red color scheme clearly distinguishes each level, while the central diagonal arrow visualizes the connection between stages. Perfect for expressing company vision, core values, and execution strategy in a structured format. The 16:9 widescreen layout is optimized for modern presentation environments. Fully editable PPTX format allows you to customize text, colors, and dimensions to match your brand identity and content needs.
Usage Points
-
Main Usage
Visualize organizational vision, goals, and strategy through a 3-level hierarchical structure to communicate clearly with executives, team members, and investors. The nested square design intuitively represents the inclusion relationship between levels, while the diagonal arrow emphasizes progression and directional flow.
-
How to Use
Insert vision, core values, and execution strategy into each nested square, or apply to hierarchical classifications such as organizational structure, product lines, or business divisions. Customize colors and text to integrate into company profiles, business plans, strategic reports, and other corporate presentations.
-
Recommended For
Ideal for executives, planning teams, marketing teams, and sales teams presenting vision, strategy, and objectives. Suitable for investor pitch decks, business plan presentations, organizational restructuring explanations, and new business introductions where hierarchical information delivery is essential.
-
Slide Structure
Composed of 3 nested squares (teal outer, yellow middle, red inner) with a central diagonal arrow indicating stage-to-stage connection. Each square provides an independent text input area for clear information separation by level. The 2-slide set includes background variations (beige and light blue) for design flexibility.
Related Products
-

Vision & Goal Square Inclusion Diagram – Strategic Business Vision Representation
#Company Introduction #Business Vision and Strategy #Diagram
-

Diagram of Corporate Direction and Goal Setting Plan
#Company Introduction #Business Vision and Strategy #Diagram
-

Vision & Goal Setting Diagram – Key to Business Vision and Strategy
#Company Introduction #Business Vision and Strategy #Diagram
-

Startup Goals and Vision Cluster Diagram
#Company Introduction #Business Vision and Strategy #Diagram
