Interrelationships between Critical Business Areas – Cluster Diagram
RB0800077_9
- Last Update 03/28/2025
- File Size 0.5MB
- # of Slides 2
- File Format PPTX
- Slide Ratio 4:3
- Color
Keywords
- #Content-Based Slides
- #Design-Based Slides
- #Product/Service Introduction
- #Business Vision and Strategy
- #Diagram
- #Features
- #Business Strategy
- #Cluster
- #Combination Diagram
- #4:3
- #cluster diagram PowerPoint
- #overlapping diagram slide
- #business relationship visualization
- #Venn diagram PPT
- #intersection diagram template
About the Product
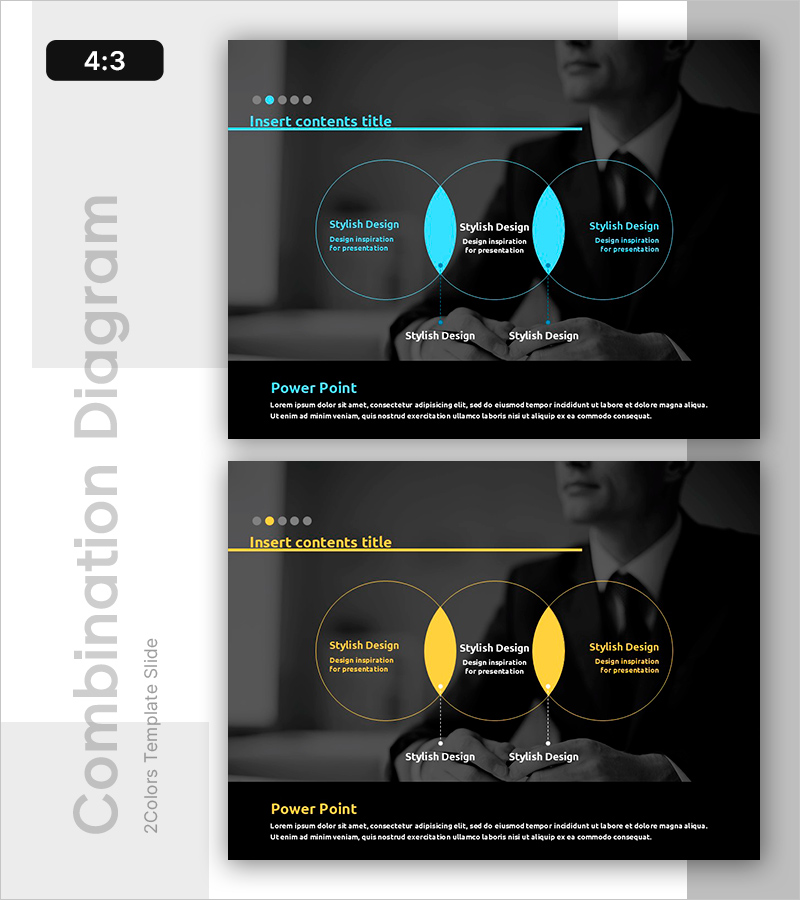
A cluster diagram PowerPoint slide featuring three circular nodes that overlap to visualize interrelationships between business areas. The dark background with cyan blue accent color highlights the intersection zones, clearly conveying connectivity and commonalities across business domains. Each circular node accommodates title and descriptive text, with two additional information boxes positioned at the bottom. This 4:3 ratio, 2-slide set is ready for immediate presentation use.
Usage Points
-
Main Usage
Visualizes interrelationships and commonalities among three or more business areas, departments, services, or products. Emphasizes intersection zones to effectively communicate collaboration, synergy, and integrated strategies while making complex relationship maps intuitively understandable.
-
How to Use
Use in business strategy presentations, organizational structure explanations, partnership introductions, and product/service portfolio descriptions. Input department names, service titles, or characteristics in each circular node, and place shared values or synergies in intersection areas to highlight mutual connectivity.
-
Recommended For
Ideal for executives, strategy teams, marketing departments, and business development teams presenting business strategies, organizational restructuring, new business proposals, and partnership collaboration structures. Applicable across consulting, finance, IT, manufacturing, and various other industries.
-
Slide Structure
Three circular nodes overlap to form two intersection zones. Each node contains input areas for title and descriptive text, with two additional information boxes positioned at the bottom. Cyan blue accent color distinctly marks intersections, while light text on dark background maximizes contrast and readability.
Related Products
-

Diagram of Intergenerational Action for the Planet
#Product/Service Introduction #Business Vision and Strategy #Diagram
-

Camping Business Goal Market Strategy Diagram – Business Vision and Strategy
#Product/Service Introduction #Business Vision and Strategy #Diagram
-

Modern Presentation Expression with Attractive Color Combinations
#Product/Service Introduction #Business Vision and Strategy #Diagram
-

Definition and Goals of Education – Sustainable Development
#Business Vision and Strategy #Diagram #Business Strategy
