Camping Business Goal Market Strategy Diagram – Business Vision and Strategy
RJ0600031_29
- Last Update 06/29/2025
- File Size 1.4MB
- # of Slides 2
- File Format PPTX
- Slide Ratio 16:9
- Color
Keywords
- #Content-Based Slides
- #Design-Based Slides
- #Product/Service Introduction
- #Business Vision and Strategy
- #Diagram
- #Features
- #Business Strategy
- #Cluster
- #Combination Diagram
- #16:9
- #overlapping circle diagram PowerPoint
- #two-circle comparison slide
- #Venn diagram PowerPoint template
- #business strategy diagram
- #cluster diagram PowerPoint slide
About the Product
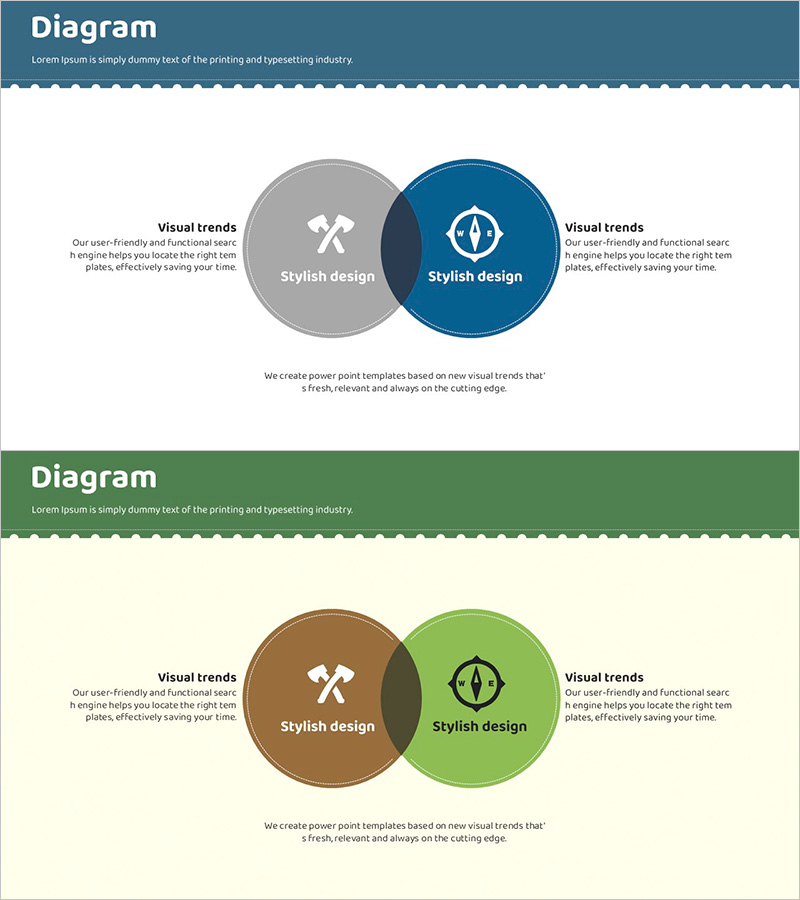
A comparison analysis diagram PowerPoint slide featuring two overlapping circular shapes in contrasting colors—gray and navy blue. Each circle contains an icon and text area to highlight key concepts, making it ideal for presenting two interrelated strategies, business visions, or organizational elements. This slide design is perfect for business plans, market strategy presentations, and competitive analysis reports. The 16:9 widescreen format ensures compatibility with modern presentation environments and displays.
Usage Points
-
Main Usage
Visualize and compare two interrelated concepts, strategies, or organizational units simultaneously. The overlapping circle structure clearly shows commonalities and differences, making it effective for business plans, strategy reports, and organizational restructuring proposals where key messages need emphasis.
-
How to Use
Edit the text and icons within each circle to match your content. Place the first concept (e.g., existing strategy) in the left gray circle and the second concept (e.g., new strategy) in the right navy circle. Add shared elements in the overlapping center area. Colors and icons can be freely customized to match your brand.
-
Recommended For
Executive presentations comparing existing vs. new business directions, marketing team competitive analysis, organizational restructuring explanations, product development technical comparisons, consulting firm strategy proposals, and cross-functional team alignment meetings.
-
Slide Structure
Two-slide set with identical overlapping circle diagram layouts. Each slide features a left gray circle (approximately 120px diameter) and right navy circle (approximately 120px diameter) overlapping by about 30% at the center. Each circle contains an icon (approximately 40px) and text area (approximately 80 characters). A title area is positioned at the top of each slide.
Related Products
-

Diagram of Intergenerational Action for the Planet
#Product/Service Introduction #Business Vision and Strategy #Diagram
-

Modern Presentation Expression with Attractive Color Combinations
#Product/Service Introduction #Business Vision and Strategy #Diagram
-

Interrelationships between Critical Business Areas – Cluster Diagram
#Product/Service Introduction #Business Vision and Strategy #Diagram
-

IT Intra Service Overlay Diagram - Service Description and Connections
#Product/Service Introduction #Diagram #Features
