Diagram Visualizing Key Growth Areas – Business Vision and Strategy
RB0800068_7
- Last Update 03/27/2025
- File Size 0.7MB
- # of Slides 2
- File Format PPTX
- Slide Ratio 4:3
- Color
Keywords
- #Content-Based Slides
- #Design-Based Slides
- #Product/Service Introduction
- #Business Vision and Strategy
- #Diagram
- #Benefits and Advantages
- #Core Competencies
- #Spread
- #Centralized Diagram
- #4:3
- #radial diagram PowerPoint
- #5-area strategy slide
- #business vision diagram
- #growth strategy template
- #center-point diagram slide
About the Product
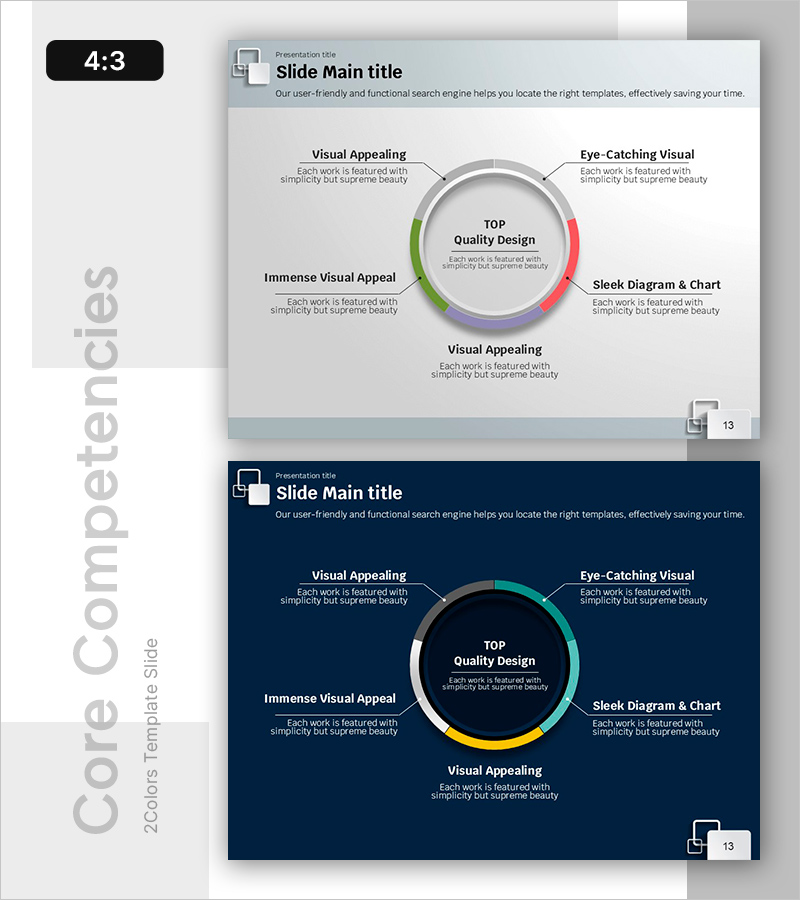
A radial diagram PowerPoint slide that visualizes business vision and strategy with five growth areas expanding from a central concept. The design uses five distinct colors—green, red, yellow, purple, and blue—to differentiate each strategic area, ensuring visual clarity and impact. Two background options (light gray and dark navy) are provided to match your presentation context and corporate branding. This 4:3 ratio, 2-slide template is ready to edit and deploy immediately for executive presentations, investor pitches, and strategic planning sessions.
Usage Points
-
Main Usage
Communicates five strategic areas, growth domains, or core values radiating from a central business vision or objective. The center-to-periphery structure clarifies strategic priorities and interconnections, making it ideal for executive briefings, investor presentations, and organizational strategy alignment sessions.
-
How to Use
Enter your core concept (vision, goal, or strategy) in the central circle, then populate the five radial sections with detailed strategies, growth areas, or execution initiatives. Customize colors and text to match your corporate brand, and add icons or metrics to increase information density as needed.
-
Recommended For
Executives, strategy managers, marketing planners, and business development teams presenting business strategies, growth roadmaps, or organizational objectives. Effective for business plans, executive reports, investor presentations, and internal strategy workshops where complex strategies must be communicated intuitively.
-
Slide Structure
Central circular hub (core concept input area) with five radial sections (individual strategy/area input zones). Each section is color-coded independently and connected to the center by lines representing hierarchical relationships. Includes two background versions: light gray and dark navy.
Related Products
-

Smart Health Diffusion Diagram – Emphasizing Business Vision
#Product/Service Introduction #Business Vision and Strategy #Diagram
-

3 Types of Wave Effects – Product and Service Introduction
#Product/Service Introduction #Business Vision and Strategy #Diagram
-

Values Carried by Nature – Value Delivery Diagram Slide
#Product/Service Introduction #Business Vision and Strategy #Diagram
-

Maple Leaf Donut Chart – Visualizing Business Vision and Strategy
#Product/Service Introduction #Business Vision and Strategy #Diagram
