Geographical Information Visualization Slide – Effective Regional Analysis
RB0800030_11
- Last Update 03/24/2025
- File Size 4.1MB
- # of Slides 2
- File Format PPTX
- Slide Ratio 4:3
- Color
Keywords
About the Product
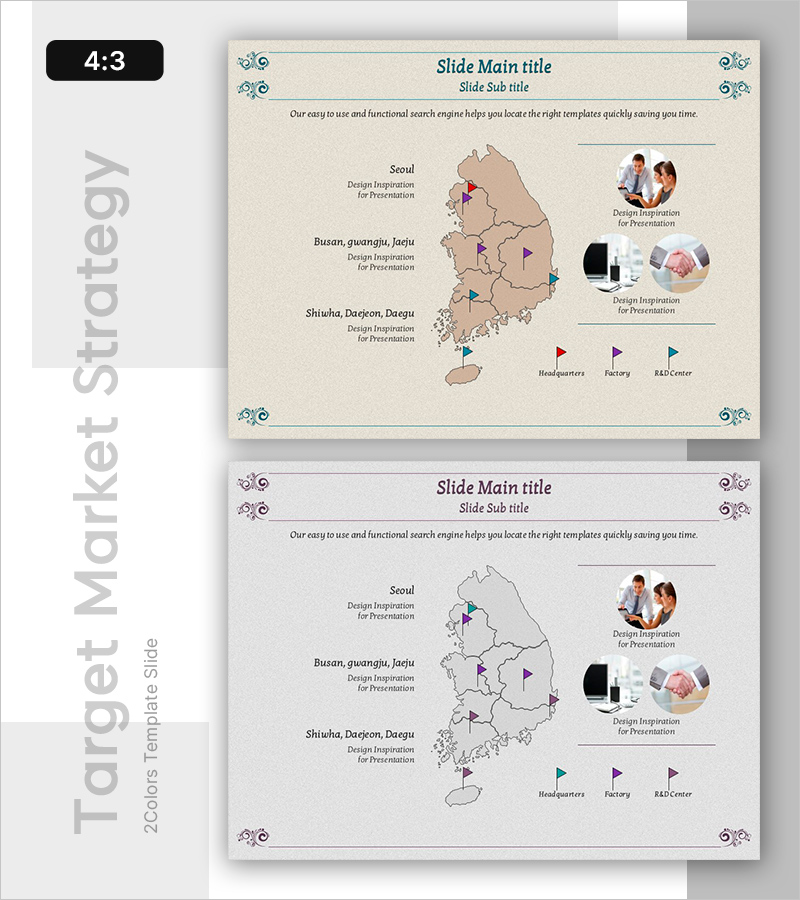
A PowerPoint slide featuring a Korea map with key regions marked by colorful pin indicators (red, purple, teal) for Seoul, Busan-Gwangju-Daegu, and Shiwa-Daejeon-Daegu. The warm beige background provides a professional backdrop, while the right side includes photo placeholders and text areas to describe regional characteristics. Optimized for 4:3 aspect ratio in 2-slide format, this presentation template is ready to use for regional analysis, market research, and business expansion planning presentations.
Usage Points
-
Main Usage
Visually display key regions of Korea on a map and compare regional characteristics, business status, and market information at a glance. Ideal for presentations on regional marketing strategies, branch expansion plans, and regional performance analysis where location data is critical.
-
How to Use
Adjust the pin positions and colors on the map to mark your business regions, then insert representative images of each region in the photo areas on the right. Fill in the text boxes with region names, descriptions, and statistical data to complete the regional information. The 2-slide format allows sequential introduction of multiple regions.
-
Recommended For
Executives and marketing teams of region-based businesses, professionals in real estate, retail, food service, and distribution industries, regional development and urban planning organizations, and management presentations on branch expansion and new market entry.
-
Slide Structure
Each slide features a title area at the top, a Korea map in beige tone in the center, three region name and description text boxes on the left, three circular photo placeholders on the right, and a legend showing headquarters, factory, and R&D center markers. Text and image input areas are clearly separated for easy content addition.
Related Products
-

Procurement Table PowerPoint Slide – Item Photo Budget Dark
#Product/Service Introduction #Financial Plans and Performance #Features
-

Sales Strategy PowerPoint Slide – 4-Framework Client Hub
#Product/Service Introduction #Business Vision and Strategy #Diagram
-

Business Outcome PowerPoint Slide – 3-Circle Solution Hub
#Company Introduction #Business Strategy #Diagram
-

Market Demand Analysis PowerPoint Slide – Donut Chart Layout
#Market and Competitor Analysis #Graph #Customer Analysis
