AI Bottleneck Detection PowerPoint Slide – 3-KPI Layout
RBTK0500001_5
- Last Update 05/04/2026
- File Size 33.5MB
- # of Slides 2
- File Format PPTX
- Slide Ratio 16:9
- Color
Keywords
- #Content-Based Slides
- #Design-Based Slides
- #Company Introduction
- #Business Vision and Strategy
- #Operational Plan
- #Diagram
- #Core Values, Vision, and Mission
- #Core Competencies
- #Production and Technology Development Strategy
- #Structure
- #Tree Diagram
- #16:9
- #AI bottleneck detection PowerPoint slide
- #core technology KPI presentation template
- #AI operations optimization slide deck
- #bottleneck detection engine PowerPoint
- #technical capability KPI presentation
About the Product
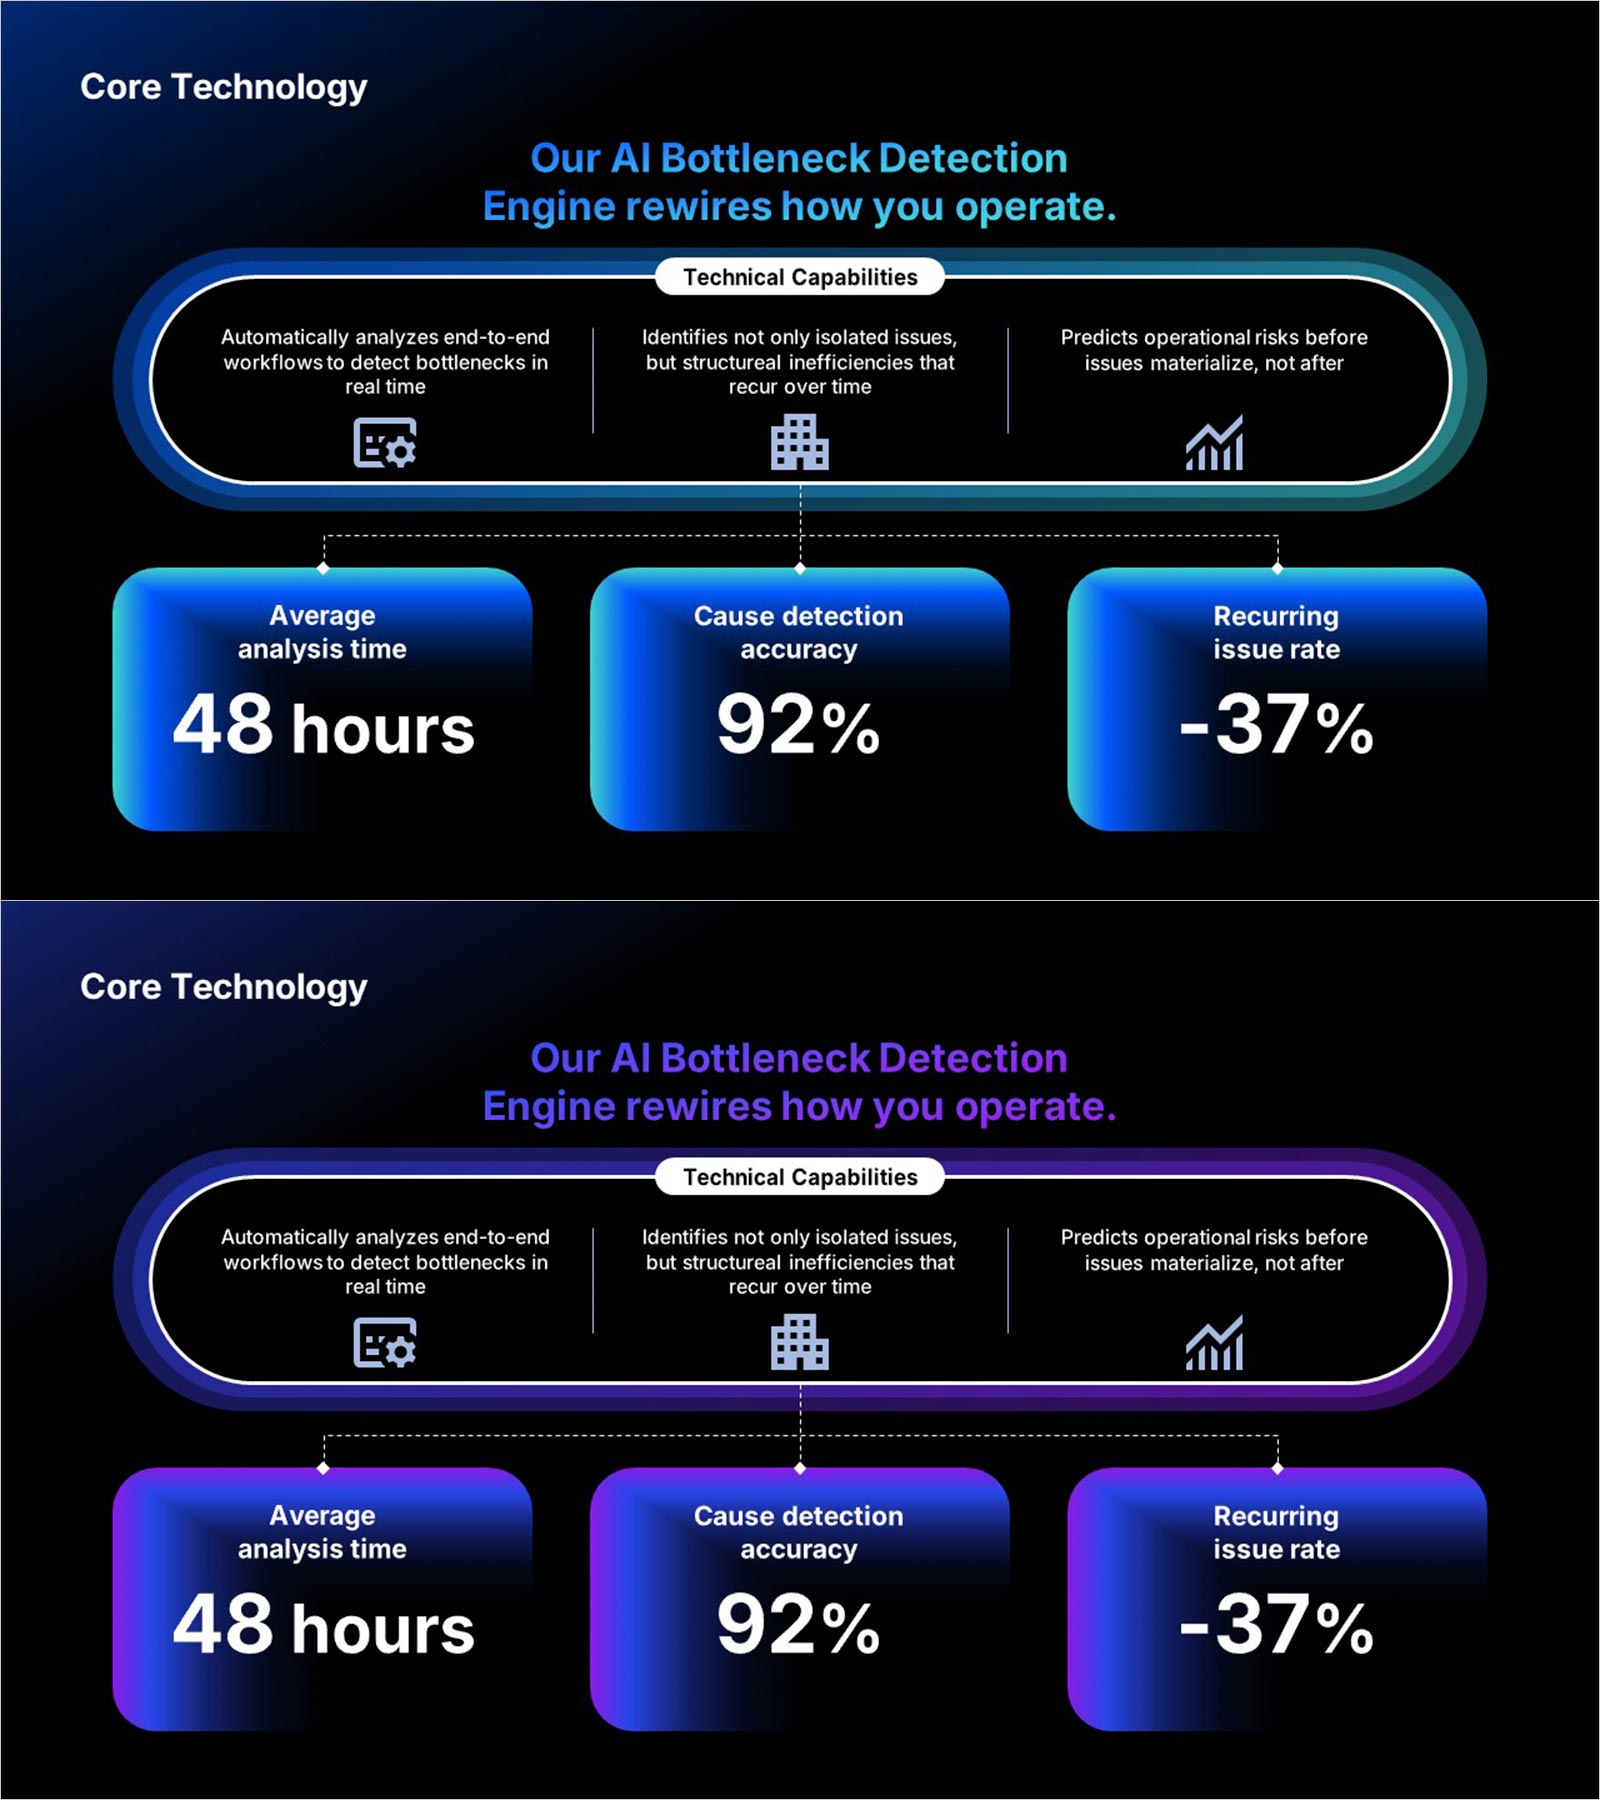
AI bottleneck detection PowerPoint slide combining a three-capability panel with three KPI result cards. Technical Capabilities section presents real-time workflow analysis, structural inefficiency identification, and predictive risk detection. Dashed arrows connect to KPI cards showing Average Analysis Time (48 hours), Cause Detection Accuracy (92%), and Recurring Issue Rate (-37%). Dark background in blue-gradient and purple-gradient versions. Editable in PowerPoint for AI tech pitch decks and investor IR reports.
Usage Points
-
Main Usage
Use as the core technology section in AI solution pitch decks and IR presentations. Presents three technical capabilities and three KPI outcomes on one PowerPoint slide.
-
How to Use
Replace the three technical capability texts and icons with your technology features. Update the three KPI card values and labels with your performance data in PowerPoint.
-
Recommended For
Ideal for AI startup founders, technology teams, and product managers presenting AI performance data and technical capabilities to investors and enterprise clients.
-
Slide Structure
One slide. Core Technology label and headline. Three-column capability panel with icons. Three KPI cards connected by dashed arrows. Blue and purple dark versions.
Related Products
-

Positive Way of Thinking Slide – Communicating Vision and Core Values
#Company Introduction #Business Vision and Strategy #Core Values, Vision, and Mission
-

Setting Key Business Goals – Tree Diagram for Vision and Objective Achievement
#Business Vision and Strategy #Diagram #Business Goals
-

Creative Strategies Page – Design Embodying Vision and Core Values
#Company Introduction #Business Vision and Strategy #Core Values, Vision, and Mission
-

Idea Core Competency Connection Diagram – A Fusion of Vision and Strategy
#Company Introduction #Business Vision and Strategy #Diagram
