Structuring Data Across 6 Folders – Effective Data Visualization
RB0800029-1_16
- Last Update 03/24/2025
- File Size 0.4MB
- # of Slides 2
- File Format PPTX
- Slide Ratio 4:3
- Color
Keywords
- #Content-Based Slides
- #Design-Based Slides
- #Product/Service Introduction
- #Business Introduction
- #Diagram
- #Composition
- #Business Areas
- #Structure
- #Spread
- #Tree Diagram
- #Centralized Diagram
- #4:3
- #radial diagram PowerPoint
- #data structure visualization slide
- #6-folder diagram template
- #business organization chart
- #center-point diagram PowerPoint download
About the Product
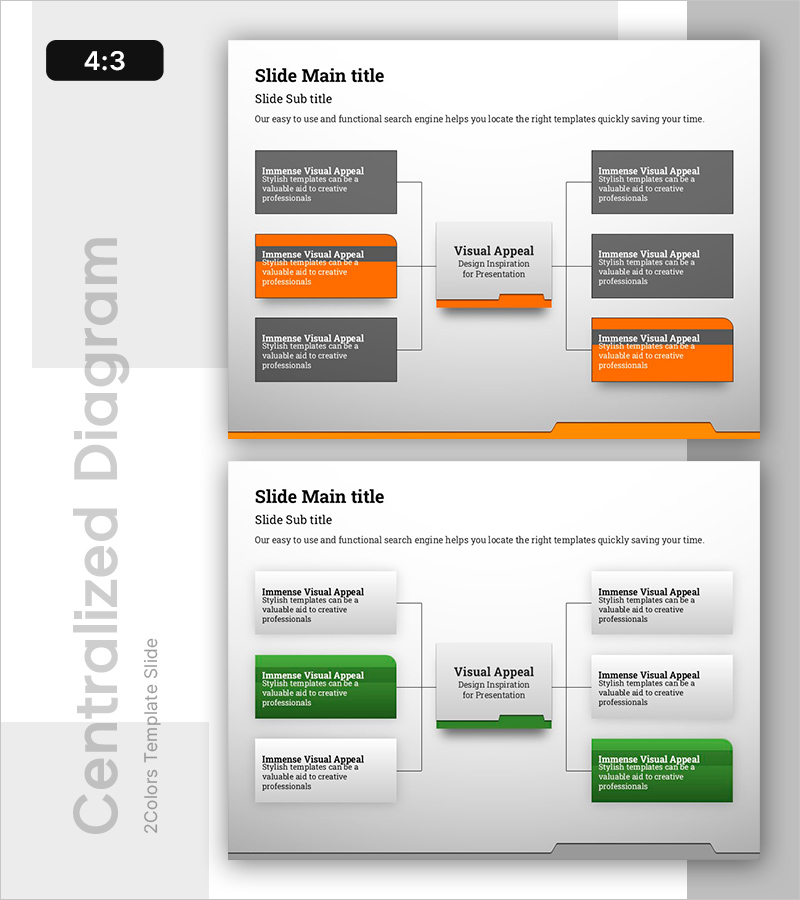
A radial data structure diagram PowerPoint slide that systematically organizes business data across 6 folders. The central 'Visual Appeal' concept connects to 3 categories on each side, creating a 6-node radial structure ideal for visualizing data classification, organizational hierarchies, and process stages. The orange accent color contrasts with gray backgrounds to highlight key items, while the 4:3 aspect ratio and 2-slide format integrate seamlessly into presentations, reports, and planning documents. Each folder box includes editable text areas for customization to your specific content.
Usage Points
-
Main Usage
Visualizes organizational data classification systems, business process stages, and product/service category structures using a center-to-periphery radial layout. Positions the core message at the center and radiates related items outward, creating clear information hierarchy and logical flow.
-
How to Use
Enter your core topic (business goal, product name, or strategy) in the central box, then populate the 6 surrounding folders with subcategories, stages, or functions. During presentation, emphasize the logical flow from center to periphery, highlighting how each element connects and relates to the core concept.
-
Recommended For
Executive reports, business plan presentations, organizational structure explanations, marketing strategy sessions, product development process sharing, and team role assignments. Particularly effective when simplifying complex data into intuitive, visually organized information for stakeholder communication.
-
Slide Structure
2-slide set. First slide features orange-accented radial diagram (1 central node + 3 left nodes + 3 right nodes = 7 total boxes); second slide uses gray-tone version of identical structure. All boxes support text editing, with arrows and connector lines clearly showing relationships between center and peripheral elements.
Related Products
-

Eco-friendly Furniture Product Overview – Diagram Emphasizing Sustainability
#Product/Service Introduction #Business Introduction #Diagram
-

Business Structure Area Diagram – Providing Business Insights with Modern Design
#Company Introduction #Business Introduction #Diagram
-

Global Network Service Composition – Contemporary Style Diagram
#Product/Service Introduction #Business Introduction #Diagram
-

Earth Analysis Diagram – Business Area Introduction
#Product/Service Introduction #Business Introduction #Diagram
