Earth Analysis Diagram – Business Area Introduction
RJ0700010_25
- Last Update 07/24/2025
- File Size 0.6MB
- # of Slides 2
- File Format PPTX
- Slide Ratio 16:9
- Color
Keywords
- #Content-Based Slides
- #Design-Based Slides
- #Product/Service Introduction
- #Business Introduction
- #Diagram
- #Composition
- #Business Areas
- #Spread
- #Centralized Diagram
- #16:9
- #radial diagram PowerPoint slide
- #earth analysis presentation
- #business area diagram
- #central node template
- #product introduction PPT slide
About the Product
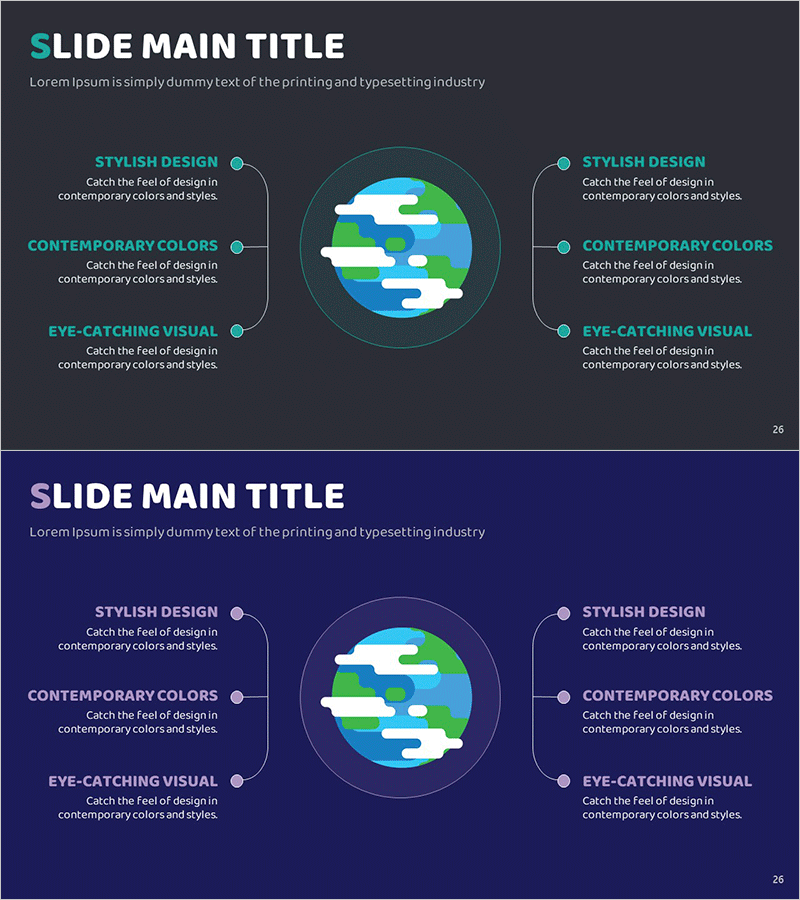
A PowerPoint slide featuring a radial diagram with a central globe surrounded by six business area nodes. The dark gray background displays an earth illustration with cyan, green, and blue gradient colors, connected to surrounding elements via lines and circular nodes. Ideal for product introductions, business area analysis, and service portfolio presentations. The 2-slide set includes dark gray and navy blue background versions in 16:9 widescreen format, perfect for modern presentation environments.
Usage Points
-
Main Usage
Systematically present corporate business areas, product portfolios, and service categories using a central node structure. The globe-centered design effectively visualizes global business expansion, international operations, and diversified business portfolios in a professional manner.
-
How to Use
Insert into company profile presentations, product portfolio sections, and business analysis reports. Edit the text boxes at each connection point to add area names, and adjust colors and node sizes to emphasize specific business segments as needed.
-
Recommended For
Product marketing managers, business strategy planners, executives preparing reports, and professionals explaining multi-sector operations. Particularly effective for IR materials, investor presentations, and corporate profile pitches from startups and large enterprises.
-
Slide Structure
2-slide set with dark gray background on slide 1 and navy blue on slide 2. Each slide features a central gradient globe (cyan, green, blue) with six directional nodes positioned at cardinal and diagonal points, connected by lines with editable text fields beside each node.
Related Products
-

Global Network Service Composition – Contemporary Style Diagram
#Product/Service Introduction #Business Introduction #Diagram
-

System Architecture Diagram Slide with Core Modules
#Product/Service Introduction #Business Introduction #Diagram
-

Technical Configuration Diagram – Information Spreading Visually Centered
#Product/Service Introduction #Business Introduction #Diagram
-

Subject Learning Elements Diagram – Visualizing Business Regions and Structure
#Product/Service Introduction #Business Introduction #Diagram
