Simple Organizational Chart Box – Emphasizing Structure and Efficiency
RB0800025_4
- Last Update 03/23/2025
- File Size 0.2MB
- # of Slides 2
- File Format PPTX
- Slide Ratio 4:3
- Color
Keywords
About the Product
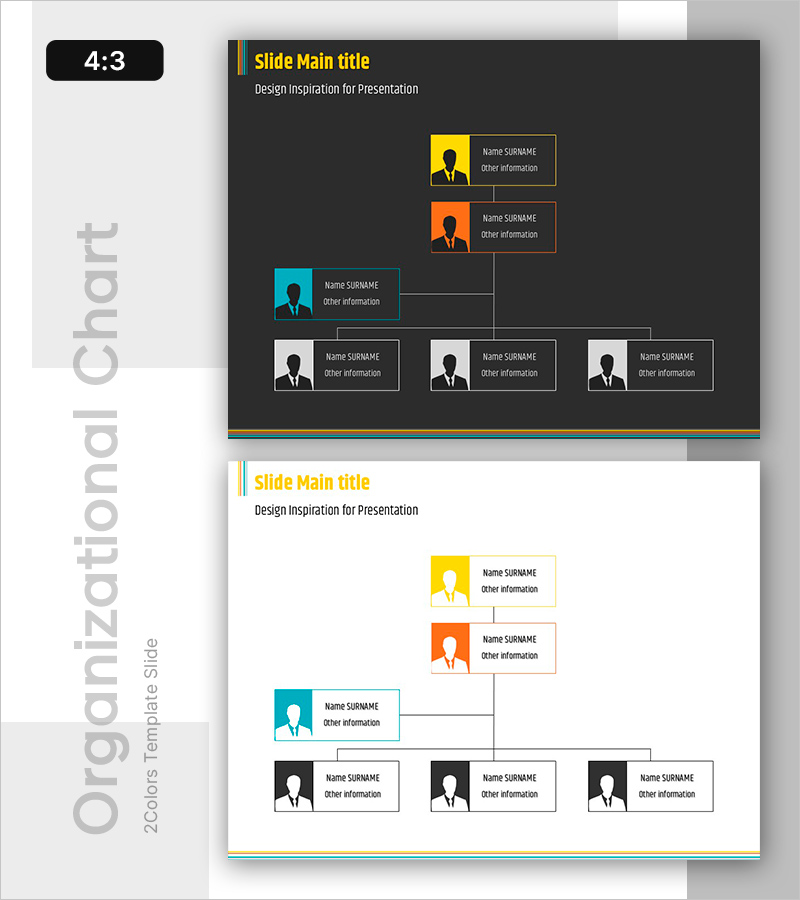
A tree diagram PowerPoint slide that clearly visualizes organizational structure and reporting relationships. The slide features a 5-node hierarchical structure expanding from 1 top-level position through 2 middle-level and 3 lower-level positions, each represented in distinct color boxes: yellow, orange, cyan, and gray. Each box includes space for employee silhouette, name, and title information, with connecting lines showing reporting relationships. The 2-slide set provides both dark and white background versions to suit different presentation contexts. This organizational chart slide is optimized for company structure presentations, team composition displays, and decision-making hierarchy visualization.
Usage Points
-
Main Usage
Visually communicate organizational hierarchy and reporting structure with clarity and impact. The color-coded boxes emphasize different organizational levels, improving audience understanding of company structure. Editable name and title fields allow mapping of actual team members to the organizational framework.
-
How to Use
Use in company overview presentations during the organizational structure section to explain team composition. Ideal for executive introductions, departmental leadership overview, and project team structure explanation. Customize each box with actual employee names and titles to match your organization.
-
Recommended For
HR professionals, executives, team leaders, and organizational development specialists. Suitable for new employee orientation, organizational restructuring announcements, and internal communication about decision-making authority. Recommended for consulting firms and large organizations requiring formal organizational presentations.
-
Slide Structure
2-slide set featuring dark background and white background versions. Each slide displays a 5-node tree structure: 1 top-level node, 2 second-level nodes, and 3 third-level nodes. Color-coded boxes (yellow, orange, cyan, gray) distinguish hierarchical levels, with connecting lines indicating reporting relationships.
Related Products
-

Online Business Relationship Diagram - Effective System Composition
#Company Introduction #Technical Approach #Diagram
-

Visualizing Organizational Structure with Business System Architecture
#Company Introduction #Technical Approach #Diagram
-

Company Team Structure – Clear Presentation Through Organizational Chart
#Company Introduction #Diagram #Organizational Chart
-

Organizational Chart Network Mind Map Slide
#Company Introduction #Technical Approach #Diagram
