Structured Analysis by Category – Data Visualization Diagram
RB0800025_16
- Last Update 03/23/2025
- File Size 0.2MB
- # of Slides 2
- File Format PPTX
- Slide Ratio 4:3
- Color
Keywords
About the Product
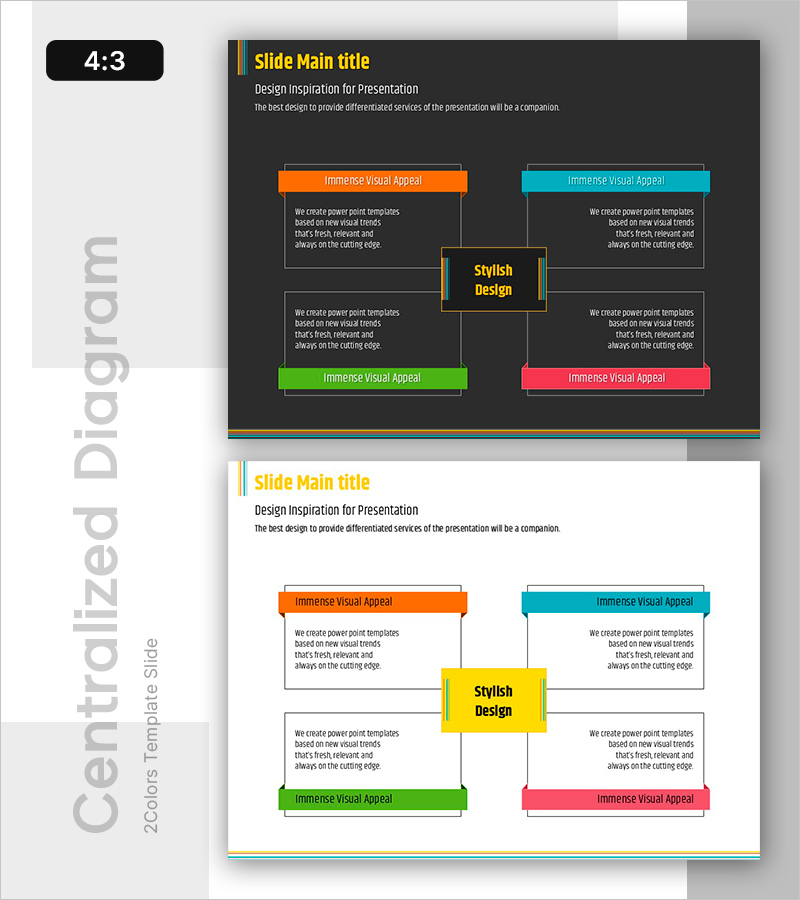
This free PowerPoint slide features a centralized expansion diagram that connects a core concept in the center to four surrounding items arranged in all four directions. Two color versions are included: a charcoal dark background and a clean white light background, allowing you to match the tone of your presentation. Each of the four boxes consists of a colored header bar in orange, teal, green, or pink, paired with a body text area for detailed descriptions. Simply enter your core keyword in the center rectangle and fill in the four surrounding boxes to complete a ready-to-use presentation slide. This single-slide diagram is ideal for business plans, proposals, and company profiles where you need to visually organize four components, strategies, or characteristics of a key concept. For a wider collection of centralized and expansion diagram slides, explore the full library at GoodPello.
Usage Points
-
Main Usage
Use this slide to visually organize four components, features, or strategic directions around a single core concept. It fits naturally into business plans, proposals, and company profiles as a body slide that summarizes key ideas at a glance.
-
How to Use
Enter your core keyword in the center rectangle, then replace the header labels and body text in each of the four surrounding boxes. Choose between the dark charcoal or white background version to match your presentation environment.
-
Recommended For
Recommended for planners, consultants, and marketers who need to present four aspects of a key concept visually. Suitable for strategy presentations, product feature overviews, and service structure explanations across various industries.
-
Slide Structure
1-slide layout with a centralized expansion diagram: 1 center core box plus 4 directional header-and-body boxes. Includes dark and light background versions. 4:3 ratio, PPTX format.


