Regional Diagram Slide for Business Location Introduction
RB0800024_6
- Last Update 03/22/2025
- File Size 1.7MB
- # of Slides 2
- File Format PPTX
- Slide Ratio 4:3
Keywords
About the Product
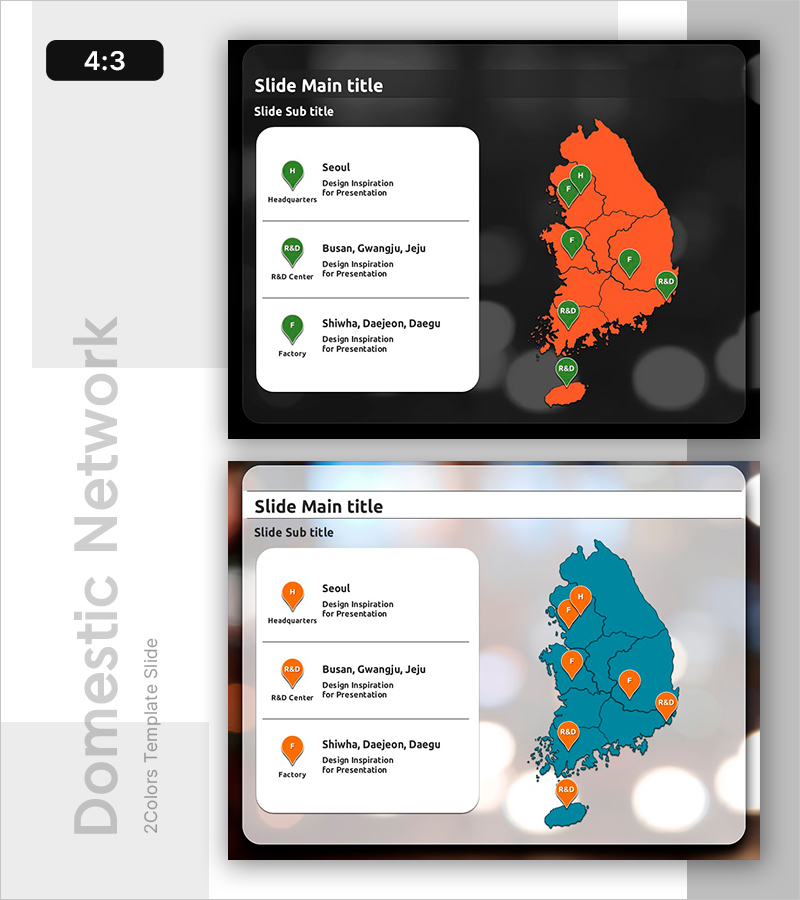
A regional diagram PowerPoint slide that displays major business locations such as headquarters, R&D centers, and factories on a Korea map using pin markers. The 2-slide set provides two color versions—dark tone (black background with orange map) and light tone (white background with teal map)—allowing you to match your presentation style. The left text box accommodates location names, functions, and descriptions for each site, while the right map area shows pin placements, creating a clear information hierarchy. This slide effectively communicates global network distribution, regional office locations, and business presence in company introduction presentations.
Usage Points
-
Main Usage
Visualize a company's domestic business locations, regional offices, and network distribution on a map-based layout to convey organizational scale and geographic business presence to investors, partners, and clients with credibility. Simultaneously display function labels for each site (headquarters, R&D, factory) to integrate organizational structure with geographic positioning.
-
How to Use
Enter each location's name (e.g., Seoul Headquarters), function (e.g., Headquarters), and description in the left text box. Adjust pin markers on the right map with location abbreviations (H, R&D, F) and reposition as needed. Select either the dark-tone or light-tone version to match your presentation background color.
-
Recommended For
Ideal for company introduction decks, investor pitch presentations, and business briefing slides explaining domestic office distribution. Suitable for manufacturing, distribution, and service companies operating multiple regional locations. Effectively communicates company scale and geographic coverage to partners, clients, and investors.
-
Slide Structure
2-slide set with dark tone (black background, orange map, green pins) and light tone (white background, teal map, orange pins) versions. Each slide features a 2-column layout with three location information boxes on the left (name, function, description) and a Korea map area on the right, creating balanced text and map information placement.
Related Products
-

Customer Reviews PowerPoint Slide – Photo Grid Speech Bubble
#Customer Success Stories #Text Box #Customer Testimonials and Feedback
-

Contact Closing PowerPoint Slide – Interior Dark Two-Column
#Company Introduction #Contact Information
-

Plastic Waste Emission PowerPoint Slide – Donut Chart
#Market and Competitor Analysis #Corporate Social Responsibility #Graph
-

Problem Definition PowerPoint Slide – 4-Step Flow Diagram
#Company Introduction #Business Strategy #Diagram
