Tracking Online Performance with Captivating Visual Design
RB0800024_5
- Last Update 03/22/2025
- File Size 1.5MB
- # of Slides 2
- File Format PPTX
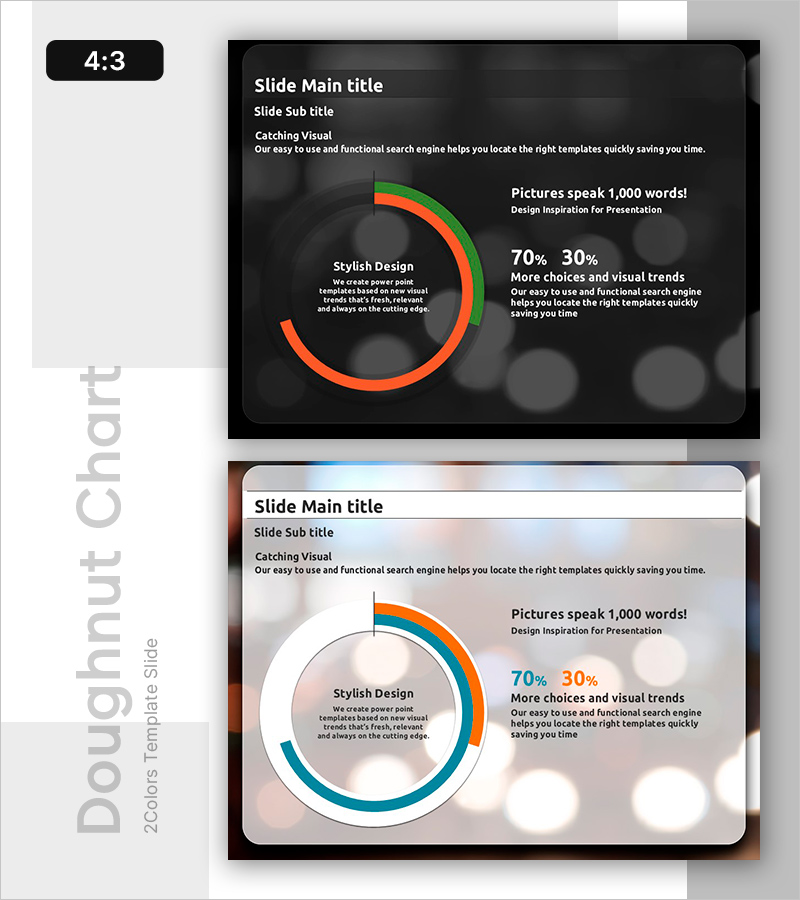
- Slide Ratio 4:3
Keywords
About the Product
A 2-slide PowerPoint presentation designed to effectively communicate online performance metrics and KPIs. The slides feature multi-color donut charts (orange, green, blue) on a dark background, enabling intuitive comparison of numerical data. The first slide includes title, subtitle, descriptive text, and the primary chart layout, while the second slide offers a light background variation for contrast. Instantly applicable to presentations, reports, and marketing plans when explaining performance indicators, KPIs, and achievement rates.
Usage Points
-
Main Usage
This slide is designed to visually communicate numerical metrics such as online marketing performance, KPIs, and goal achievement rates. The multi-color donut chart enables viewers to instantly grasp multiple data points and comparisons, effectively capturing audience attention during presentations.
-
How to Use
Insert into marketing plans, business reports, investor pitches, or performance analysis documents in the metrics section. Edit chart values, labels, and text with your own data, then select either the dark or light background slide based on your presentation context.
-
Recommended For
Ideal for marketing professionals, executives, data analysts, and project managers presenting performance metrics. Particularly suited for presentations comparing multiple online indicators such as advertising ROI, website traffic, conversion rates, and customer satisfaction scores.
-
Slide Structure
2-slide layout with each slide divided into title area, subtitle area, descriptive text area, and multi-color donut chart area. The first slide features a dark background with three-color chart (orange, green, blue), while the second offers a light background with identical chart placement for situational flexibility.
Related Products
-

Project Overview PowerPoint Slide – 4-Spec Dark Real Estate
#Product/Service Introduction #Business Strategy #Diagram
-

Contact Closing PowerPoint Slide – Interior Dark Two-Column
#Company Introduction #Contact Information
-

Sales Strategy PowerPoint Slide – 4-Framework Client Hub
#Product/Service Introduction #Business Vision and Strategy #Diagram
-

F&B Menu PowerPoint Slide – Circular 4-Step Process Layout
#Operational Plan #Diagram #Business Processes
