Visualizing Product-specific Target Achievement Percentage – Cluster Diagram
RB0800022_8
- Last Update 03/22/2025
- File Size 1MB
- # of Slides 2
- File Format PPTX
- Slide Ratio 4:3
- Color
Keywords
- #Content-Based Slides
- #Design-Based Slides
- #Company Introduction
- #Financial Plans and Performance
- #Diagram
- #Key Achievements
- #Sales and Revenue
- #Cluster
- #Inclusive Cluster Diagram
- #Chain Diagram
- #4:3
- #cluster diagram PowerPoint
- #concentric circle chart
- #target achievement rate slide
- #data visualization PPT
- #financial performance presentation
About the Product
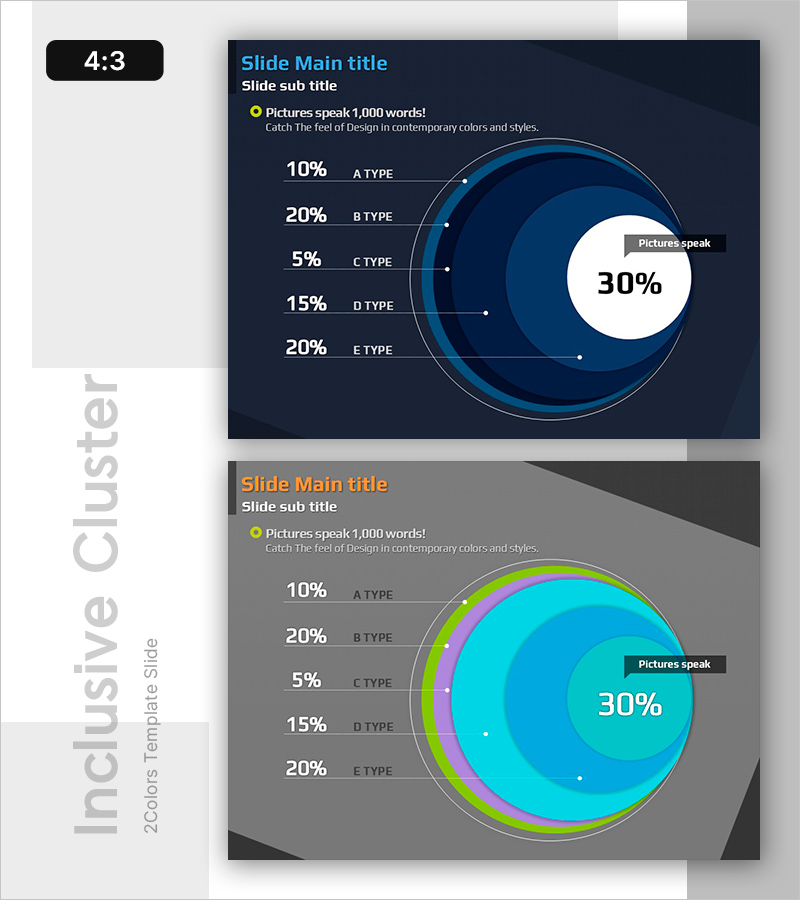
A PowerPoint slide that visualizes product-specific target achievement percentages using a concentric circle cluster structure. The design features a central key metric (30%) surrounded by five achievement rates (10%, 20%, 5%, 15%, 20%) arranged in hierarchical layers. Dark blue background with gradient-processed concentric circles and white point markers clearly indicate data connections. Ideal for financial performance reports, product performance analysis, departmental goal tracking, and comparative business presentations. Delivered in 4:3 aspect ratio with 2 fully editable slides.
Usage Points
-
Main Usage
Enables hierarchical comparison of product, departmental, and team target achievement rates while illustrating the relationship between core metrics and detailed items at a glance. The concentric structure emphasizes central performance while intuitively expressing connections with surrounding elements.
-
How to Use
Apply in financial report performance analysis sections, quarterly business performance presentations, product portfolio performance reviews, and departmental KPI achievement status reports. Simply edit text and numerical values directly to input actual data.
-
Recommended For
CFOs, financial managers, business strategy professionals, product managers, and performance evaluation executives presenting to executive boards, investor briefings, and quarterly earnings calls.
-
Slide Structure
2-slide set: First slide features dark blue background with concentric cluster (5 layers), central circular area displaying core metric 30%, left side listing five achievement rates. Second slide presents identical structure with gradient multi-color background (cyan, lime, pink, purple) offering color variation options.
Related Products
-

Expected Effect Inclusion Diagram – Visualizing Strategy and Operations
#Operational Plan #Marketing Plan and Strategy #Diagram
-

Goal Target Setting – Core of Marketing Strategy
#Marketing Plan and Strategy #Diagram #Marketing Objectives
-

Visualizing Key Automotive Strategy – Cluster and Connection
#Product/Service Introduction #Operational Plan #Diagram
-

Visualizing Business Activities – Innovative Components
#Product/Service Introduction #Business Introduction #Diagram
