Business Location and Infrastructure Presentation Template
RB0800020_12
- Last Update 03/21/2025
- File Size 1.5MB
- # of Slides 2
- File Format PPTX
- Slide Ratio 4:3
Keywords
About the Product
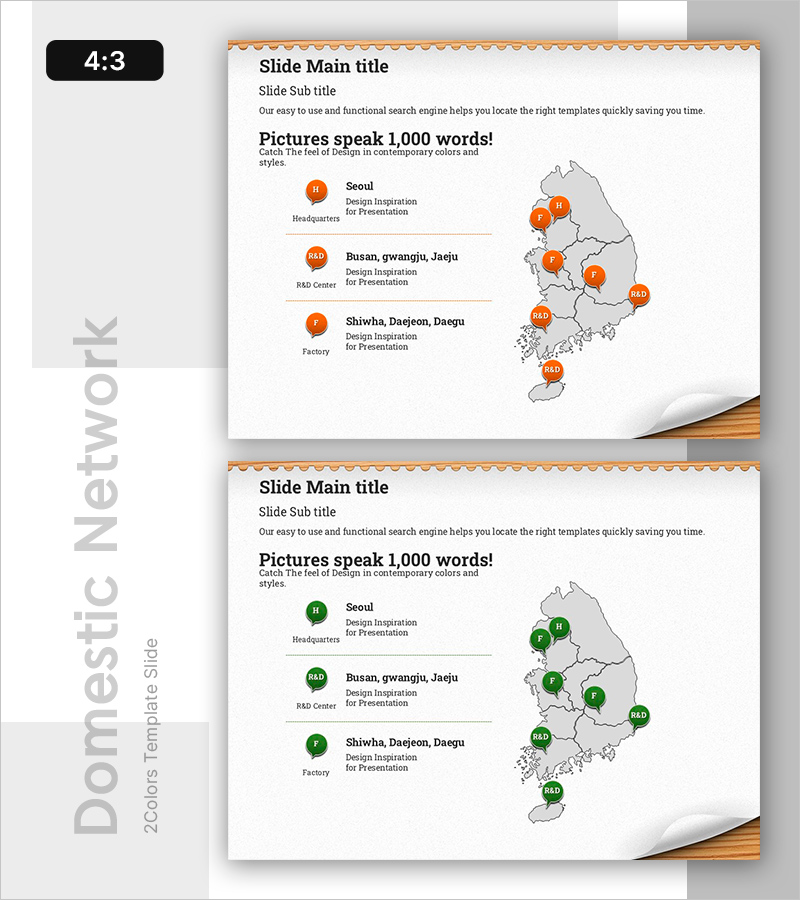
A 2-slide PowerPoint presentation set visualizing business locations and infrastructure across a South Korea map using orange markers. Display headquarters, R&D centers, and factories by region with editable text areas on the left side describing each facility's function. Optimized for company overview presentations to effectively communicate business infrastructure and operational footprint to investors and partners. Ready-to-edit PPTX format in 4:3 aspect ratio.
Usage Points
-
Main Usage
Geographically visualize key business facilities (headquarters, R&D centers, manufacturing plants) and operational infrastructure to demonstrate company scale and geographic reach to investors, partners, and stakeholders. Map-based layout combines location data with functional descriptions in a single visual.
-
How to Use
Enter facility names (Seoul, Busan, Daegu) and functions (Headquarters, R&D Center, Factory) in the left text areas, then adjust orange marker positions on the map as needed. Insert into company overview decks, business plans, or investor pitch presentations in the 'Business Infrastructure' or 'Global Operations' section to emphasize physical footprint.
-
Recommended For
Large-scale manufacturing, distribution, and technology companies presenting company overviews, investor relations pitches, partnership proposals, and employee onboarding materials. Particularly effective when organizations operate multiple facilities and need to visually demonstrate business scale and regional expansion.
-
Slide Structure
2-slide set: Slide 1 features orange markers indicating 3 locations (headquarters, R&D center, factory) with 3 corresponding text input areas on the left for facility descriptions. Slide 2 uses green markers with identical layout. Each slide includes title and subtitle areas with map positioned on the right for clear information hierarchy.
Related Products
-

Project Overview PowerPoint Slide – 4-Spec Dark Real Estate
#Product/Service Introduction #Business Strategy #Diagram
-

Contact Closing PowerPoint Slide – Interior Dark Two-Column
#Company Introduction #Contact Information
-

Customer Reviews PowerPoint Slide – Photo Grid Speech Bubble
#Customer Success Stories #Text Box #Customer Testimonials and Feedback
-

Procurement Table PowerPoint Slide – Item Photo Budget Dark
#Product/Service Introduction #Financial Plans and Performance #Features
