Line History Diagram: Optimized Design for Time Series Data Analysis
RB0800019_4
- Last Update 03/21/2025
- File Size 2.7MB
- # of Slides 2
- File Format PPTX
- Slide Ratio 4:3
- Color
Keywords
- #Content-Based Slides
- #Design-Based Slides
- #Operational Plan
- #Technical Approach
- #Diagram
- #Business Processes
- #Service Implementation Plan
- #Cluster
- #Chain Diagram
- #4:3
- #line diagram PowerPoint
- #timeline chart slide
- #time series data visualization
- #history diagram template
- #data trend presentation
- #connected node diagram
About the Product
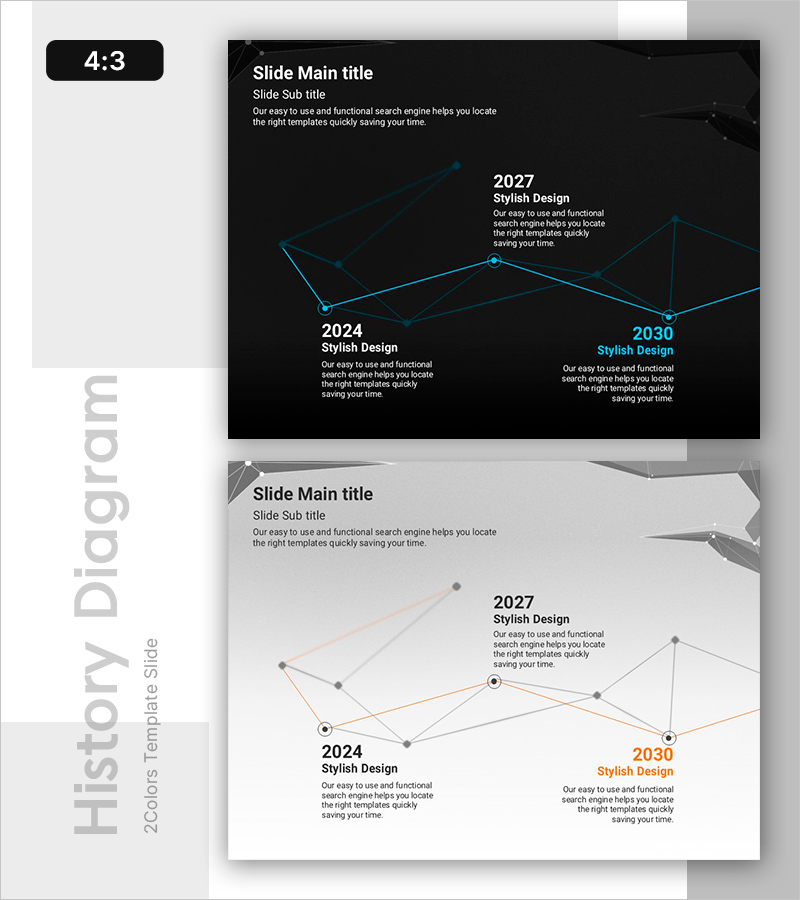
A minimalist line history diagram PowerPoint slide that visualizes data changes over time with clarity and precision. Featuring a dark background with cyan connecting lines and circular nodes, this slide effectively displays three time points (2024, 2027, 2030) in a single view. Each node includes dedicated text areas for adding year-specific insights, milestones, or strategic goals. The design is ideal for business presentations, progress reports, and technical analyses where temporal data or phased developments need clear visualization. The 4:3 aspect ratio with 2 slides allows immediate customization and integration into your deck.
Usage Points
-
Main Usage
Designed to represent data evolution, phased progress, and year-over-year trends in a visually compelling format. Ideal for communicating business strategy evolution, technology roadmaps, and organizational growth trajectories across multiple time horizons.
-
How to Use
Edit the text areas within each node to insert years, milestones, or key achievements. Adjust line colors and thickness as needed to emphasize critical transitions. Deploy in strategy, results, or technology sections of presentations where temporal flow is essential.
-
Recommended For
Executives, strategy managers, technology leaders, and marketing teams presenting business plans, technology roadmaps, or market analysis findings. Particularly effective for investor pitch decks, quarterly performance reviews, and long-term strategic planning presentations.
-
Slide Structure
Dark background with cyan connecting lines linking three circular nodes representing 2024, 2027, and 2030. Each node features a centered year label with adjacent text areas for detailed descriptions. Two-slide layout includes a grayscale variant for design flexibility.
Related Products
-

Sleek Presentation Template Emphasizing Business Context
#Business Strategy #Operational Plan #Technical Approach
-

Collaborative Workflow in Construction Project – Effective and Innovative Diagram
#Operational Plan #Technical Approach #Diagram
-

Business Process 3D Diagram – Innovation and Structure
#Operational Plan #Technical Approach #Diagram
-

Idea Meeting Process - Multidirectional Flow Diagram
#Business Strategy #Operational Plan #Diagram
