Square Diffusion Diagram – Visual Impact and Stylish Design
RB0800017_11
- Last Update 03/21/2025
- File Size 1.7MB
- # of Slides 2
- File Format PPTX
- Slide Ratio 4:3
- Color
Keywords
About the Product
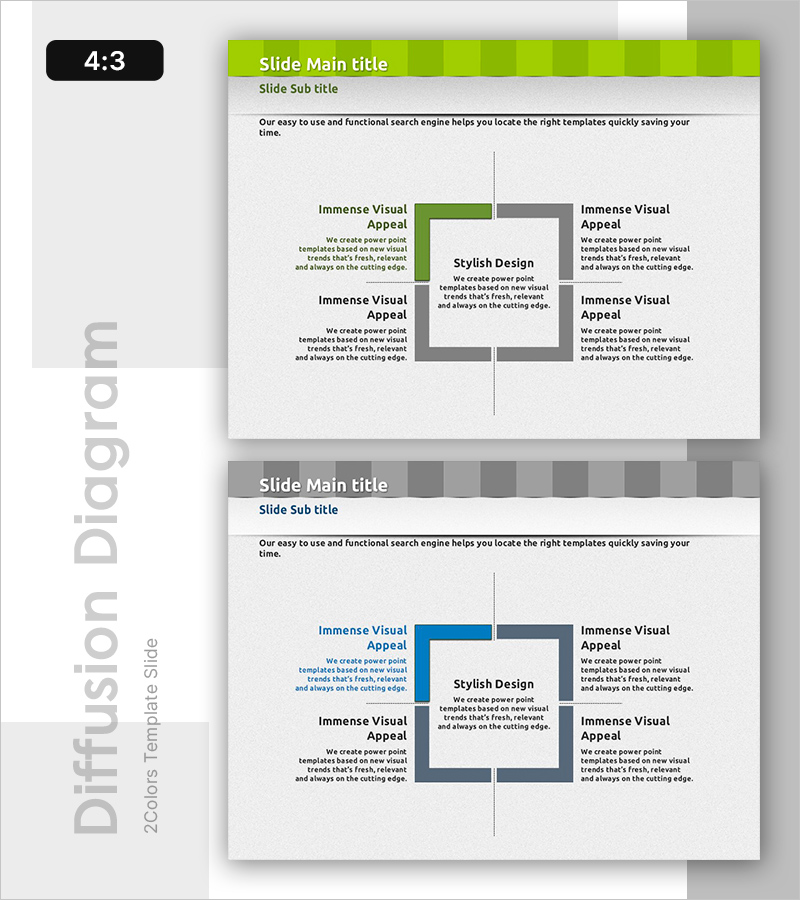
A radial diagram PowerPoint slide featuring a central concept expanding into four directional quadrants. The design uses lime green and gray color contrast to emphasize visual hierarchy, with dedicated text areas and description spaces in each direction. The 2-slide set provides identical layout variations for flexible multi-topic applications. Perfect for presentations that require clear center-to-periphery relationships and equal emphasis on four supporting elements.
Usage Points
-
Main Usage
Visualize organizational strategy with four execution pillars, product features mapped to four use cases, or project goals branching into four implementation directions. Effectively clarifies center-periphery relationships and demonstrates how a core concept generates four equal outcomes.
-
How to Use
Enter your core concept in the central square, then populate the four directional text areas with supporting details. Place key points in the lime green accent bars for maximum visual emphasis. Both slides share the same structure, allowing you to present multiple topics sequentially with consistent formatting.
-
Recommended For
Executive strategy presentations explaining four strategic pillars, marketing plans segmenting target audiences into four categories, business proposals outlining four implementation axes, or organizational restructuring announcements. Ideal when four elements require equal visual weight and emphasis.
-
Slide Structure
Central square (core message) + four directional text boxes (one per quadrant) + four lime green accent bars + four gray background zones. 4:3 aspect ratio, 2-slide set with identical layout variations.
Related Products
-

Pyramid Diagram Template for Global Business Planning
#Marketing Plan and Strategy #Diagram #Target Market Strategy
-

Graph of User Status Analysis by Age Group
#Market and Competitor Analysis #Diagram #Graph
-

Introduction to Healthcare Business Services – Utilizing Cluster Diagram
#Product/Service Introduction #Diagram #Product/Service Introduction
-

Rhombus Presentation Template Infographic – Business Strategy Presentation
#Business Strategy #Diagram #Text Box
