Effective Visual Communication Using 75% and 25% Ratios
RB0800016_8
- Last Update 03/21/2025
- File Size 2.8MB
- # of Slides 2
- File Format PPTX
- Slide Ratio 4:3
Keywords
About the Product
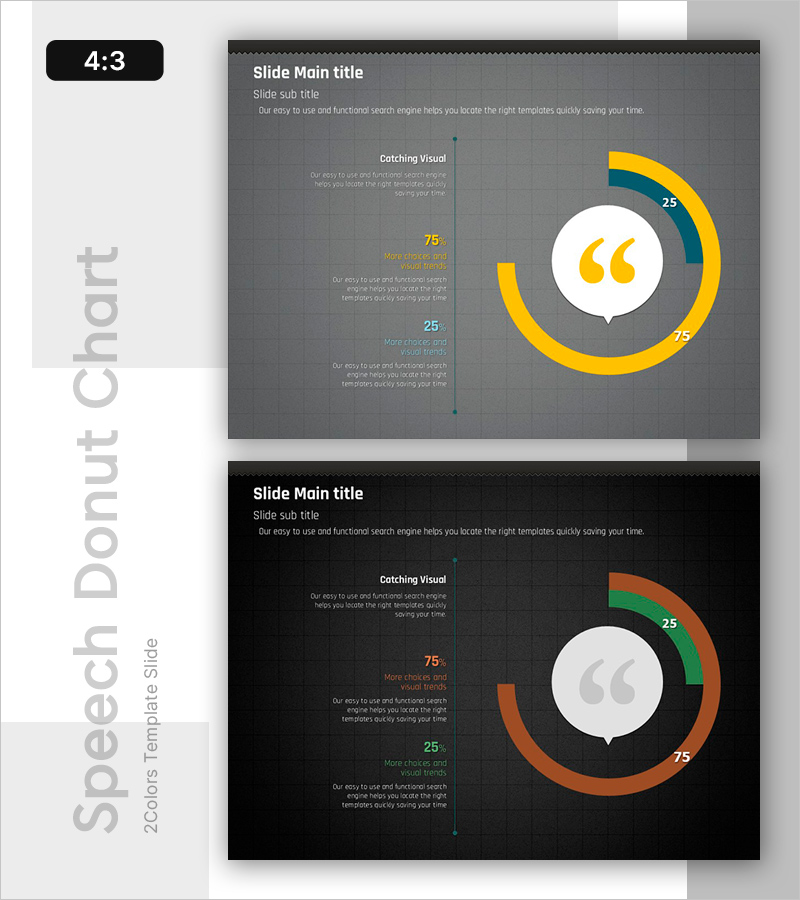
A PowerPoint slide featuring a donut chart that visually represents a 75% and 25% ratio comparison. Set against a dark gray background, the slide uses yellow, blue, orange, and green color segments to highlight key metrics. Two color variations (blue-yellow and orange-green) are included for flexible brand customization. The left side contains a detailed text description area, making it ideal for presenting market analysis, customer feedback, performance metrics, and other data-driven insights. Delivered in 4:3 aspect ratio PPTX format for seamless compatibility with existing presentations.
Usage Points
-
Main Usage
Effectively communicate two key metrics such as market share, customer satisfaction, or achievement rates. The donut chart's center space allows you to emphasize a core message or quote, capturing audience attention and reinforcing your main point.
-
How to Use
Enter your analysis context and interpretation in the left text area, then update the donut chart percentages (75%, 25%) with your actual data. Adjust colors to match your corporate branding, and replace the center quote icon with your logo or key message. Use both slides sequentially or selectively based on your presentation flow.
-
Recommended For
Executive reports, investor presentations, marketing strategy pitches, and business performance analysis. Ideal for consulting firms, financial institutions, marketing teams, and sales departments presenting quantitative findings and supporting data-driven decision-making.
-
Slide Structure
Each slide features a title and subtitle area at the top, a left-side text description block (3-4 lines), and a right-side donut chart. The chart contains three segments (75% primary color, 25% secondary color, and top accent color) with a center quote symbol and numerical values.
Related Products
-

Campaign Goals & Funnel Outcomes Slide – Blue & Green
#Business Strategy #Marketing Plan and Strategy #Diagram
-

Market Overview PowerPoint Slide – Two Panel Market Analysis
#Market and Competitor Analysis #Graph #Market Status
-

Product Roadmap PowerPoint Slide – Q1 to Q4 Launch Matrix
#Product/Service Introduction #Business Strategy #Development Plan
-

Team Mission & Org Structure PowerPoint Slide – Dark & Light
#Business Strategy #Business Management #Operational Plan
