Visualizing Global Market Flow with Maps – Concise Information Delivery Slide
RB0800015_19
- Last Update 03/20/2025
- File Size 0.7MB
- # of Slides 2
- File Format PPTX
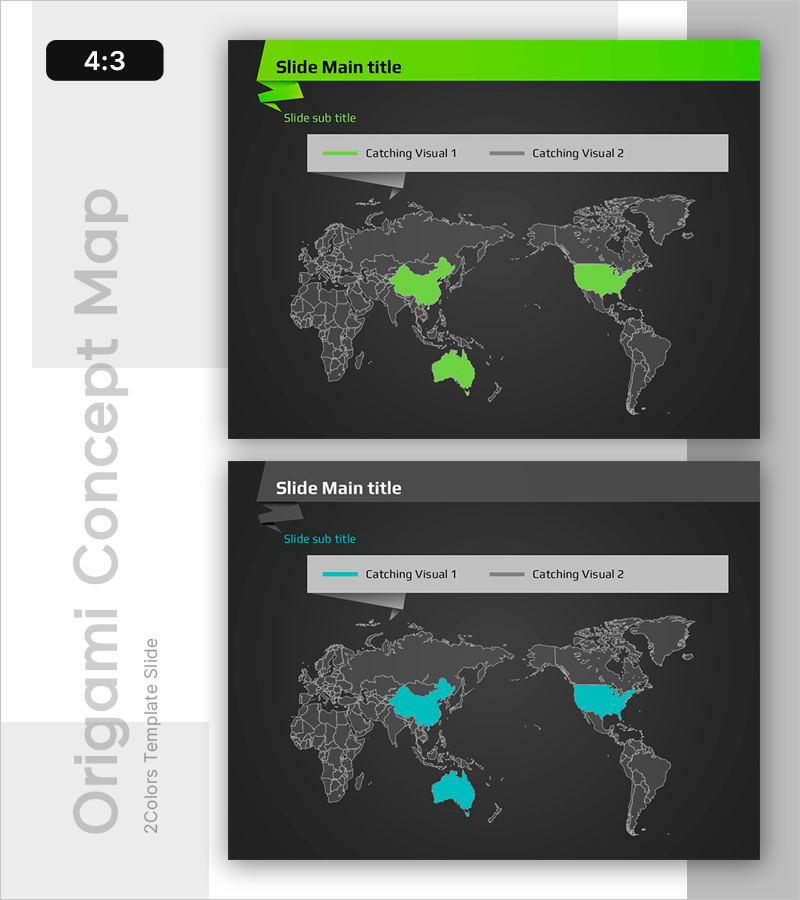
- Slide Ratio 4:3
Keywords
About the Product
A 2-slide PowerPoint presentation that visualizes global market conditions through map-based visualization. Dark background with lime green and cyan blue accent colors enables clear comparison of two market indicators across regions. Structured legend, title, and subtitle areas make it immediately applicable for market analysis, global strategy presentations, and investor reports. Provided in 4:3 ratio PPTX format with fully editable country-level data highlight zones for customization.
Usage Points
-
Main Usage
Visualizes global market conditions, regional business distribution, and country-level sales or market share through map-based representation to present decision-making insights clearly. Enables geographic scope and market size communication to investors, partners, and stakeholders.
-
How to Use
Use in market analysis or competitive analysis sections when explaining global expansion status or target markets. Edit legend colors and country highlight zones to match your data, then adjust title and subtitle to fit your report context.
-
Recommended For
Ideal for global business strategy presentations, investment pitch decks, market analysis reports, regional sales performance sharing, and international partnership negotiation materials. Primary users include executives, investors, international sales teams, and strategic planning departments.
-
Slide Structure
Comprises title and subtitle area at top (1 zone), world map in center (country-level highlighting available), and legend in upper right (2 indicator differentiation). Features 3 text input areas and 2 map data highlight zones supporting comparative information structure.
Related Products
-

Customer Reviews PowerPoint Slide – Photo Grid Speech Bubble
#Customer Success Stories #Text Box #Customer Testimonials and Feedback
-

Market Demand Analysis PowerPoint Slide – Donut Chart Layout
#Market and Competitor Analysis #Graph #Customer Analysis
-

Contact Closing PowerPoint Slide – Interior Dark Two-Column
#Company Introduction #Contact Information
-

Plastic Waste Emission PowerPoint Slide – Donut Chart
#Market and Competitor Analysis #Corporate Social Responsibility #Graph
