Presentation Material Using Maps – Introduction and Analysis
RB0800014_5
- Last Update 03/20/2025
- File Size 0.3MB
- # of Slides 2
- File Format PPTX
- Slide Ratio 4:3
Keywords
About the Product
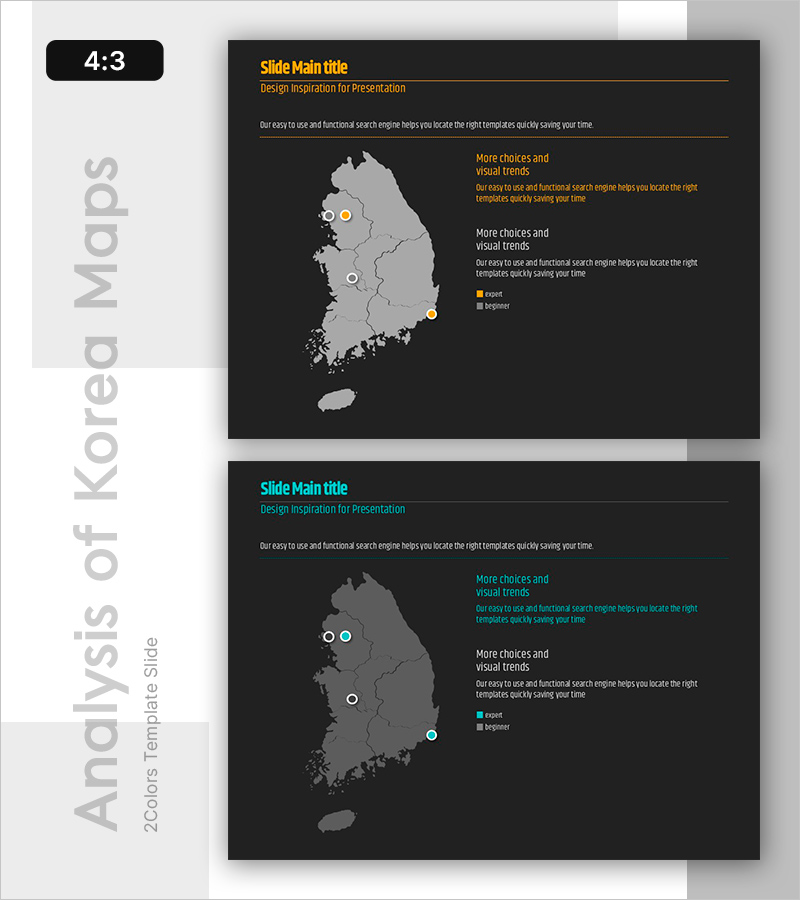
A PowerPoint slide for regional analysis and market overview presentations using a Korea map. The dark background features a gray map with orange and blue point markers that intuitively represent regional data. The 2-slide set allows you to present introduction and analysis content with dedicated text areas and a legend to clearly communicate regional statistics, performance, and customer distribution. Ready to use immediately for market analysis, sales performance, and regional strategy presentations.
Usage Points
-
Main Usage
Visually represent regional data, market share, sales performance, and customer distribution using a Korea map, effectively communicating analysis results. Designed to make complex regional information instantly understandable through point markers and a legend.
-
How to Use
Use in market analysis, sales strategy, regional expansion, and customer distribution analysis sections by adding data points to the map. Enter regional statistics, performance metrics, and insights in the text area and clarify point meanings through the legend.
-
Recommended For
Sales and marketing teams presenting regional performance reports, executive briefings on market conditions, investor presentations on regional strategies, consulting firms delivering market analysis reports, and real estate, retail, and financial industry professionals making location-based presentations.
-
Slide Structure
2-slide set with each slide containing a Korea map (center), title and subtitle area (top), text description area (right), and legend (bottom). 3–5 point markers on the map indicate regions, with corresponding data and analysis details in the right text block.
Related Products
-

Project Overview PowerPoint Slide – 4-Spec Dark Real Estate
#Product/Service Introduction #Business Strategy #Diagram
-

Market Demand Analysis PowerPoint Slide – Donut Chart Layout
#Market and Competitor Analysis #Graph #Customer Analysis
-

Contact Closing PowerPoint Slide – Interior Dark Two-Column
#Company Introduction #Contact Information
-

Customer Reviews PowerPoint Slide – Photo Grid Speech Bubble
#Customer Success Stories #Text Box #Customer Testimonials and Feedback
