Linear Graph Slide for Data Analysis – Showcase Expertise and Trust
RB0800013_13
- Last Update 03/20/2025
- File Size 7.6MB
- # of Slides 2
- File Format PPTX
- Slide Ratio 4:3
Keywords
About the Product
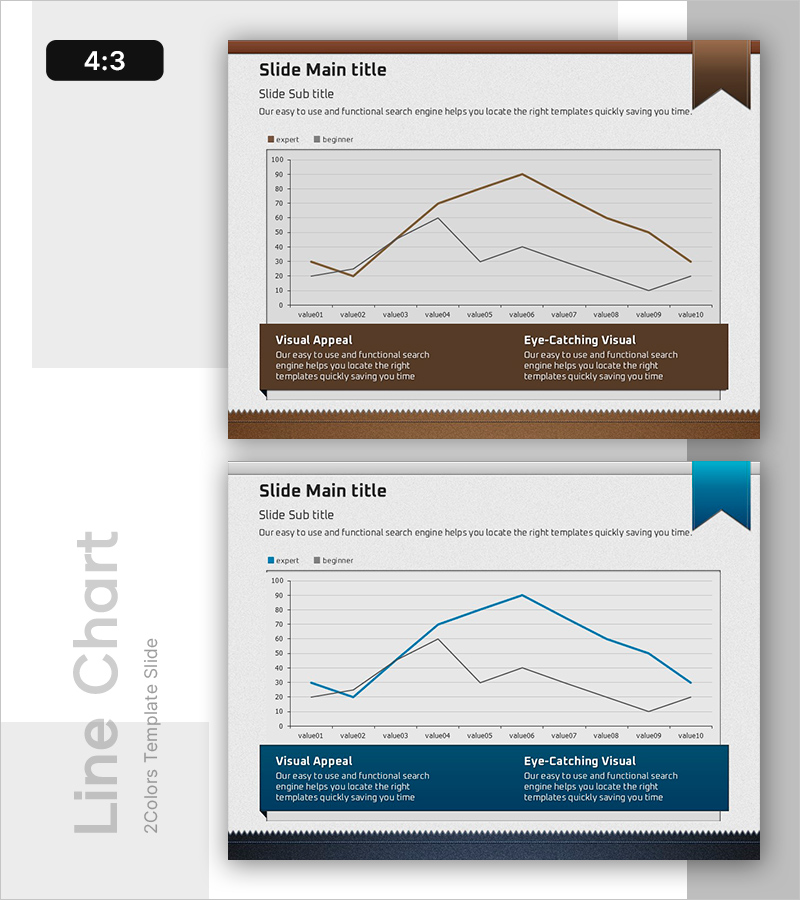
A PowerPoint slide template featuring a dual-line graph comparing two data series across ten data points. The brown and blue lines represent Expert and Beginner metrics, enabling clear visual comparison of trends and performance variations. The slide includes a title section with main heading, subtitle, and descriptive text at the top, followed by a prominent line chart in the center, and two insight text boxes at the bottom labeled Visual Appeal and Eye-Catching Visual. Formatted in 4:3 aspect ratio with 2 slides, this template is ready for immediate use in financial reports, market analysis presentations, performance reviews, and business intelligence dashboards.
Usage Points
-
Main Usage
Visualize multi-series data trends using a dual-line graph to communicate comparative analysis results clearly. The brown and blue lines represent two distinct groups, metrics, or performance indicators, making it ideal for presenting side-by-side comparisons and supporting data-driven decision-making.
-
How to Use
Apply this slide in financial reports for revenue comparisons, market analysis sections for competitive benchmarking, performance presentations for goal-versus-actual tracking, and marketing dashboards for channel-performance analysis. Edit the top text area with your title and description, then populate the bottom insight boxes with key findings.
-
Recommended For
Finance teams presenting quarterly or annual performance metrics, marketing teams analyzing campaign effectiveness, executives reviewing KPI trends, investors evaluating growth rates, and consultants presenting before-and-after analysis or comparative research findings.
-
Slide Structure
Top section with title, subtitle, and descriptive text (3 lines); central dual-line graph with 10 data points; bottom section with two insight text boxes (Visual Appeal and Eye-Catching Visual) creating a clear information hierarchy.
Related Products
-

Project Overview PowerPoint Slide – 4-Spec Dark Real Estate
#Product/Service Introduction #Business Strategy #Diagram
-

Procurement Table PowerPoint Slide – Item Photo Budget Dark
#Product/Service Introduction #Financial Plans and Performance #Features
-

Plastic Waste Emission PowerPoint Slide – Donut Chart
#Market and Competitor Analysis #Corporate Social Responsibility #Graph
-

Market Demand Analysis PowerPoint Slide – Donut Chart Layout
#Market and Competitor Analysis #Graph #Customer Analysis
