Leather PPT Schedule – Efficient Time Management
RB0800011_15
- Last Update 03/19/2025
- File Size 7.5MB
- # of Slides 2
- File Format PPTX
- Slide Ratio 4:3
- Color
Keywords
About the Product
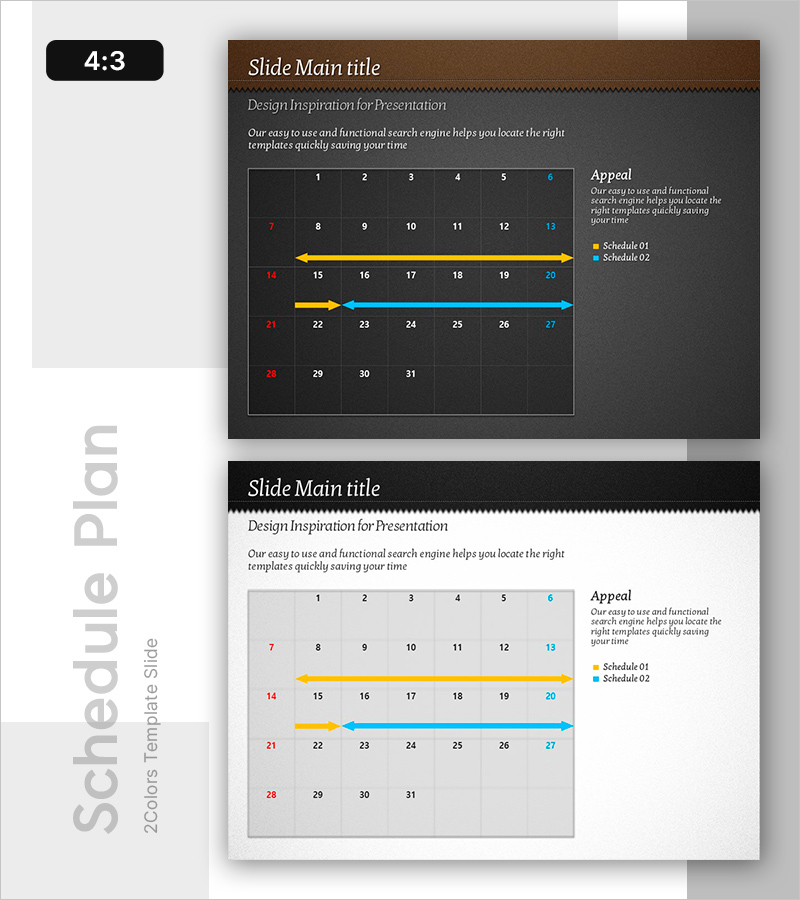
A bidirectional arrow timeline diagram PowerPoint slide designed for visualizing project schedules and parallel workflows. The slide features a leather-textured brown background with yellow and blue arrows representing two independent schedule flows, complemented by a numbered grid for clear date and milestone identification. Provided in 2-slide format with both dark and light theme versions, allowing you to match your presentation environment and document style. This PPT slide effectively communicates multiple concurrent processes and interdependent timelines in professional presentations.
Usage Points
-
Main Usage
Project schedule management, parallel process visualization, interdependent milestone representation. The bidirectional arrows enable simultaneous expression of two independent yet connected schedule flows, making complex timelines intuitive and easy to understand.
-
How to Use
Use in project kickoff meetings, business plan presentations, and marketing campaign schedule briefings. Input actual dates or week numbers in the grid, and add key activities for each phase in the arrow sections to clearly communicate timelines to team members and stakeholders.
-
Recommended For
Project managers, business planners, marketing specialists, operations team leads. Ideal for professionals who need to coordinate and share schedules across multiple departments or teams working on concurrent projects.
-
Slide Structure
2-slide set – dark theme (brown background) and light theme (gray background). Each slide includes title area at top, numbered grid (dates 1-31) in center, 2 bidirectional arrows (yellow and blue), and legend with description text on the right side.
Related Products
-

PowerPoint Template for Service Operation Strategy Presentation
#Business Management #Operational Plan #Technical Approach
-

Integrated Growth Framework Slide – 8-Step Growth Strategy
#Technical Approach #Diagram #Service Implementation Plan
-

Strategic Business Table – Business Vision and Marketing Strategy
#Business Vision and Strategy #Marketing Plan and Strategy #Diagram
-

KSF Circular Diagram – Visualizing Key Success Factors
#Product/Service Introduction #Business Vision and Strategy #Diagram
