Stripe Template for History Visualization – Modern and Stylish Design
RB0800010_6
- Last Update 03/19/2025
- File Size 1.4MB
- # of Slides 2
- File Format PPTX
- Slide Ratio 4:3
- Color
Keywords
About the Product
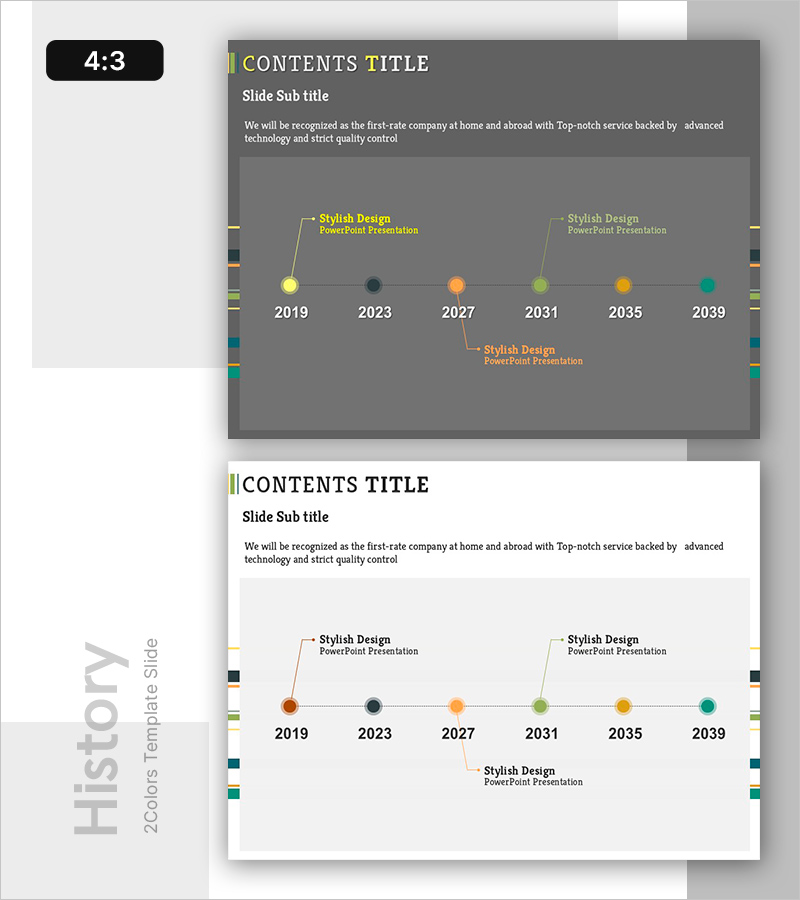
A horizontal timeline diagram PowerPoint slide visualizing company history from 2019 to 2039 with 6 color-coded nodes. The design features a dark gray background with yellow, dark blue, orange, green, orange, and teal circular nodes positioned along a central axis, each connected by vertical lines extending upward and downward to highlight key milestones. The 4:3 aspect ratio with 2-slide layout enables immediate use in presentations. Perfect for showcasing company evolution, project progression, business expansion phases, and strategic milestones in chronological order.
Usage Points
-
Main Usage
Designed to present company history, brand evolution, project milestones, and business expansion stages in chronological sequence. The 6-node structure emphasizes key events while vertical connector lines enable hierarchical presentation of supporting details and context.
-
How to Use
Enter year and event title at each node, then add detailed information on the connector lines. Colors are fully customizable by category or importance level. Node count can be adjusted for different time periods. Insert into company presentations, business plans, annual reports, and investor decks.
-
Recommended For
Ideal for executive presentations, investor pitches, company history introductions, project status reports, business performance reviews, and brand storytelling. Recommended for executives, marketing teams, project managers, and corporate training specialists.
-
Slide Structure
2-slide set. First slide features dark gray background with 6 circular nodes (yellow, dark blue, orange, green, orange, teal) arranged horizontally along a central axis, with vertical connector lines extending above and below each node. Second slide presents the same structure on a light background, offering color scheme alternatives.
Related Products
-

Latest Corporate Technology Development Issues – Innovative Solutions
#Operational Plan #Diagram #Mitigation Measures
-

Standard Blood Sugar Table by Year
#Market and Competitor Analysis #Diagram #Market Status
-

Sales & Investment Plan Slide Template
#Operational Plan #Financial Plans and Performance #Diagram
-

Table Chart on Competition and Communication - Market and Customer Analysis
#Market and Competitor Analysis #Diagram #Customer Analysis
