Origami Step Diagram – Business Goals and Strategies
RB0800007_4
- Last Update 03/18/2025
- File Size 0.2MB
- # of Slides 2
- File Format PPTX
- Slide Ratio 4:3
- Color
Keywords
- #Content-Based Slides
- #Design-Based Slides
- #Business Vision and Strategy
- #Business Strategy
- #Diagram
- #Business Goals
- #Step-by-Step Schedule Plan
- #Cluster
- #Chain Diagram
- #4:3
- #zigzag diagram PowerPoint
- #3-step flow chart slide
- #business strategy diagram
- #process flow PowerPoint template
- #step-by-step presentation slide
About the Product
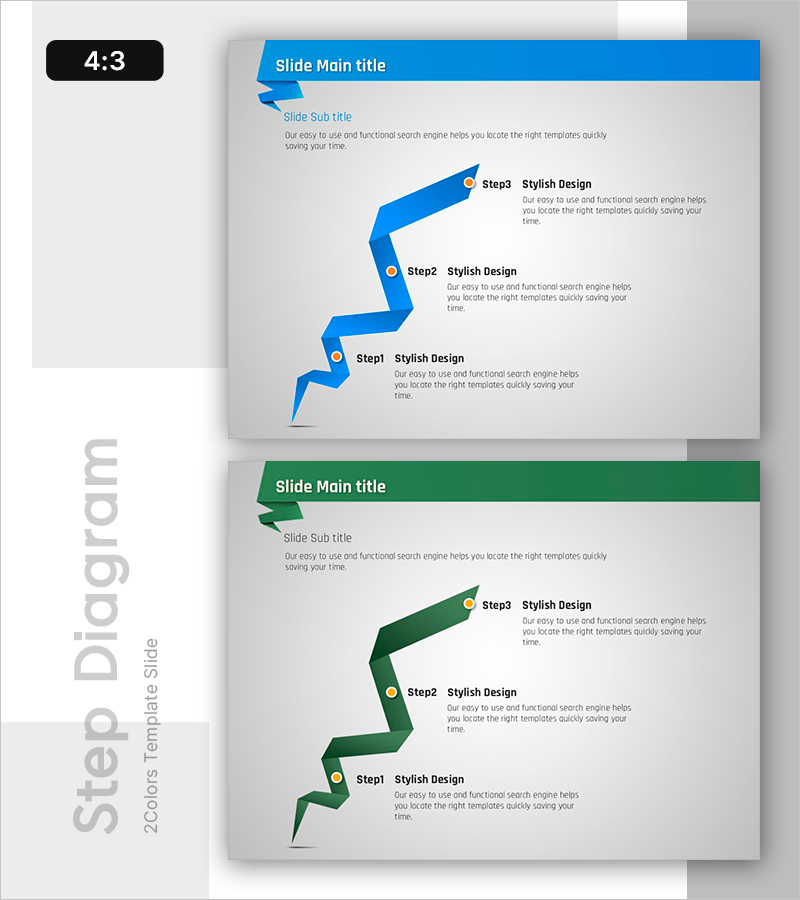
A zigzag flow diagram PowerPoint slide designed to present business goals and strategies in sequential steps. Available in two color schemes—blue and green—with circular nodes and text areas at each stage to convey process progression intuitively. Comprises 2 slides in 4:3 aspect ratio, ready for immediate use in presentations, planning documents, and reports. Clear connecting lines between stages make even complex strategies easy to understand and communicate to stakeholders.
Usage Points
-
Main Usage
Visualizes business objectives and execution strategies in sequential stages, enabling clear differentiation of goals, challenges, and outcomes at each step. Facilitates organizational communication and decision-making in executive briefings, strategy sessions, and business planning presentations by simplifying complex processes.
-
How to Use
Enter step numbers or icons in the circular nodes and add step titles, descriptions, and responsible parties in the adjacent text areas. Choose between blue or green color schemes, or customize with your organization's brand colors. Use both slides consecutively or individually as needed for your presentation flow.
-
Recommended For
Ideal for executives, planning teams, project managers, and marketing professionals presenting strategy development and implementation roadmaps. Suitable for business plans, marketing strategies, investor pitches, organizational restructuring proposals, and any business document requiring emphasis on phased change or progression.
-
Slide Structure
Features a zigzag connecting line representing 3 sequential stages. Each stage includes a circular node (Step1, Step2, Step3) paired with a text area on the right for titles and descriptions. Blue and green versions provided separately, one slide each, in 4:3 aspect ratio for consistent display across all screen formats.
Related Products
-

Step-by-step Plan for Cosmetics Production – Business Vision and Goals
#Business Vision and Strategy #Business Strategy #Diagram
-

The Climbing Journey of a Growing Professional
#Business Vision and Strategy #Business Strategy #Diagram
-

Visualizing Work Process Operation Plan – Adventure and Strategy
#Business Vision and Strategy #Business Strategy #Diagram
-

Planet Illustration Diagram – Visualizing Business Strategy
#Business Vision and Strategy #Business Strategy #Diagram
