Pentagonal Diffusion Diagram – Creative Data Visualization
RB0800005_13
- Last Update 03/18/2025
- File Size 1.9MB
- # of Slides 2
- File Format PPTX
- Slide Ratio 4:3
- Color
Keywords
About the Product
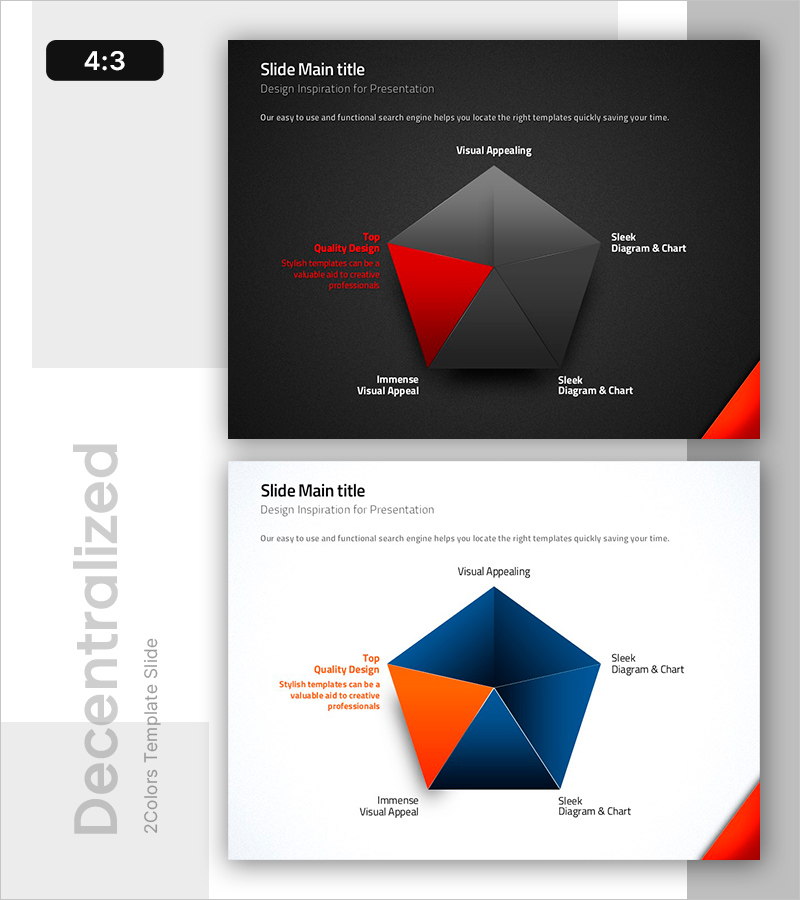
A five-point pentagonal radial diagram PowerPoint slide that visualizes diffusion from a central concept to surrounding elements. Designed with dark and light backgrounds paired with red and blue accent colors for high contrast data representation. Each vertex accommodates a key concept, making it ideal for expressing strategy, process flows, organizational structures, or decision-making frameworks with five components. The 4:3 aspect ratio, 2-slide set is fully editable and ready for corporate presentations, marketing plans, and project management materials.
Usage Points
-
Main Usage
Effectively communicates relationships where a central idea branches into five distinct elements or components. Ideal for illustrating strategic pillars, departmental structures, process phases, or multi-factor analysis frameworks in executive presentations and organizational communications.
-
How to Use
Replace the text in each vertex with your key concepts, departments, or strategic initiatives. Modify the central title to match your presentation topic. The contrasting dark and light backgrounds with red and blue accents ensure visibility in boardroom and large-audience settings. Colors and text are easily customizable in PowerPoint.
-
Recommended For
Strategic planners, marketing directors, project managers, organizational development specialists, and business analysts presenting five-component frameworks. Suitable for business plans, marketing strategies, organizational charts, decision matrices, and competitive analysis slides.
-
Slide Structure
Two-slide set: Slide 1 features a dark background with red pentagonal accent; Slide 2 has a light background with blue pentagonal accent. Each slide includes five vertex text boxes and a central title area. 4:3 aspect ratio in PPTX format, compatible with PowerPoint 2010 and later versions.
Related Products
-

Cluster Diagram Representing Business Marketing Ultimate Goals
#Business Strategy #Marketing Plan and Strategy #Diagram
-

Website Analysis Configuration Contents – Diagram and Cluster Explanation
#Product/Service Introduction #Diagram #Composition
-

Chemical Experiment Analysis Graph Chart – Visualizing R&D Achievements
#Technical Approach #Market and Competitor Analysis #Diagram
-

Medical Expenses Support Plan Slide Template – Business Introduction and Operations Planning
#Business Introduction #Operational Plan #Diagram
