Design Inspiration for Information Delivery – Visual Trends
RB0800004_5
- Last Update 03/18/2025
- File Size 3.1MB
- # of Slides 2
- File Format PPTX
- Slide Ratio 4:3
Keywords
About the Product
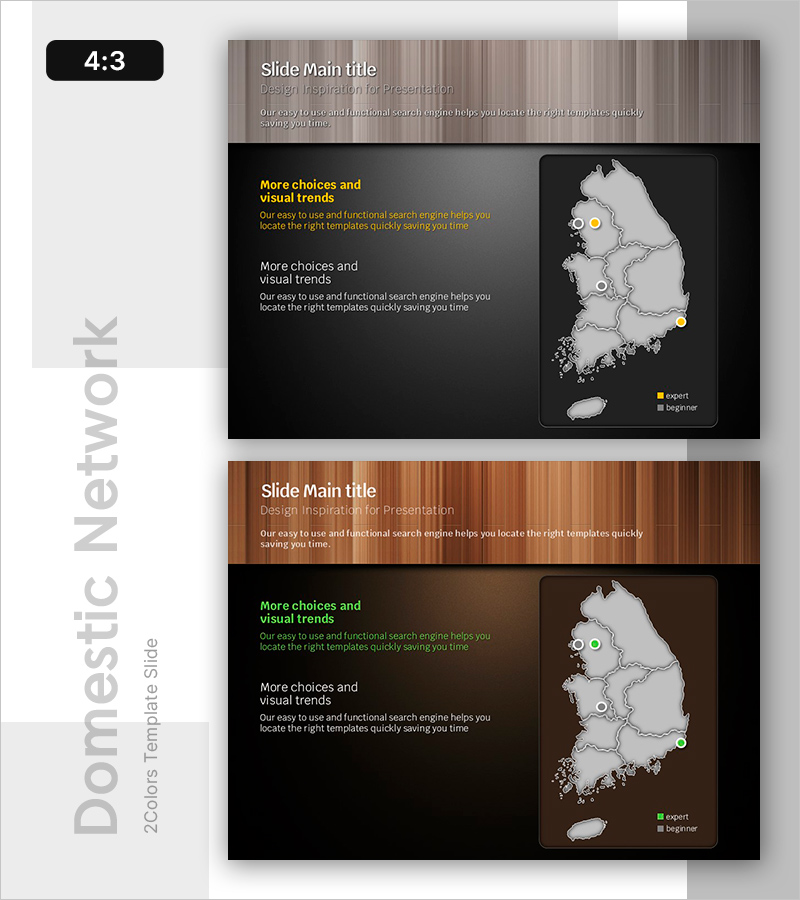
A 2-slide PowerPoint presentation designed for regional information delivery and visual trend communication. Features a Korea map background with key locations marked using circular indicators and color-coded points in a left-right comparative layout. Dark gray background with warm wood-tone header and black information boxes, using yellow, white, and gray markers to establish visual hierarchy. Instantly applicable for presentations, reports, and marketing plans that require regional strategy, network overview, or location-based analysis in your PPT slides.
Usage Points
-
Main Usage
Visualize regional distribution, network presence, and market expansion locations using map-based graphics to support decision-making. Combines text descriptions with map markers for efficient information delivery and audience engagement.
-
How to Use
Enter regional strategies, performance metrics, or plans in the left text area, then edit map marker colors and positions to update location information. Adjust marker count and legend based on presentation requirements.
-
Recommended For
Regional strategy presentations, network expansion reports, market entry planning, location-based analysis, sales performance updates, and geographic marketing analysis. Ideal for business development, regional managers, and marketing teams presenting location-dependent information.
-
Slide Structure
2-slide format with header section (title and subtitle), left text boxes (2 areas for title and descriptive content), and right map area (Korea map with 3-5 editable circular markers and legend). 4:3 aspect ratio PPTX format with fully editable text and marker elements.
Related Products
-

Sales Strategy PowerPoint Slide – 4-Framework Client Hub
#Product/Service Introduction #Business Vision and Strategy #Diagram
-

Business Outcome PowerPoint Slide – 3-Circle Solution Hub
#Company Introduction #Business Strategy #Diagram
-

Plastic Waste Emission PowerPoint Slide – Donut Chart
#Market and Competitor Analysis #Corporate Social Responsibility #Graph
-

Procurement Table PowerPoint Slide – Item Photo Budget Dark
#Product/Service Introduction #Financial Plans and Performance #Features
