Infographic Slide Emphasizing Visual Trends
RB0800003_15
- Last Update 03/17/2025
- File Size 0.1MB
- # of Slides 2
- File Format PPTX
- Slide Ratio 4:3
- Color
Keywords
About the Product
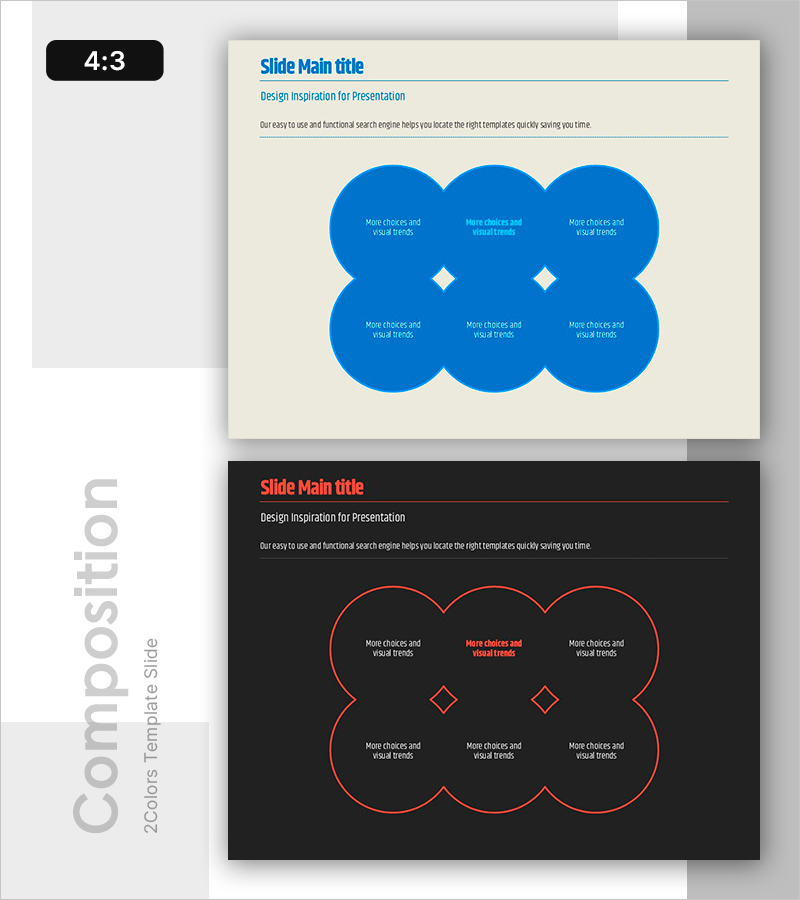
A visually engaging infographic PowerPoint slide designed to compare six items or concepts at a glance. The slide features a light beige background with blue circular shapes arranged in a grid pattern, connected by diamond-shaped connectors at the center. Each circle provides space for text and icons, making it ideal for presenting features, options, or comparative data. Two color versions—blue and red—are included, allowing you to match your brand or presentation theme. This PPT slide is ready to use in business proposals, marketing strategies, product comparisons, and corporate presentations.
Usage Points
-
Main Usage
This slide effectively presents multiple pieces of information or concepts in a structured, visually balanced format. It is ideal for comparing six features, options, or data points simultaneously, helping audiences understand relationships and make informed decisions.
-
How to Use
Enter your title and subtitle in the designated areas. Add text and icons to each circular shape to represent your six items. Use the central diamond connectors to emphasize relationships or hierarchical connections between elements. Customize colors and fonts to match your brand guidelines.
-
Recommended For
Marketing professionals, product managers, business strategists, and consultants presenting to executives, investors, or clients. Perfect for business proposals, marketing plans, product overviews, and strategic presentations requiring comparative analysis.
-
Slide Structure
The slide consists of a title and subtitle area at the top, followed by six editable circular shapes arranged in two rows of three. Central diamond connectors link the circles, creating visual cohesion. Optimized for 4:3 aspect ratio with fully customizable colors, text, and graphics.
Related Products
-

F&B Menu PowerPoint Slide – Circular 4-Step Process Layout
#Operational Plan #Diagram #Business Processes
-

Procurement Table PowerPoint Slide – Item Photo Budget Dark
#Product/Service Introduction #Financial Plans and Performance #Features
-

Plogging Route Presentation Slide – 9-Point S-Curve Timeline
#Company Introduction #Business Strategy #Corporate Social Responsibility
-

Sales Strategy PowerPoint Slide – 4-Framework Client Hub
#Product/Service Introduction #Business Vision and Strategy #Diagram
