Immune Response Analysis by Major Organs – Intuitive Diagram Slide
RB0400011-1_6
- Last Update 03/12/2025
- File Size 0.4MB
- # of Slides 2
- File Format PPTX
- Slide Ratio 4:3
- Color
Keywords
- #Content-Based Slides
- #Design-Based Slides
- #Product/Service Introduction
- #Diagram
- #Product/Service Introduction
- #Development Plan
- #Structure
- #Cluster
- #Pyramid Chart
- #Closed Cluster Diagram
- #4:3
- #closed-form diagram PowerPoint
- #3-step circular node slide
- #medical product introduction presentation
- #diagram PowerPoint slide
- #pharmaceutical development plan template
About the Product
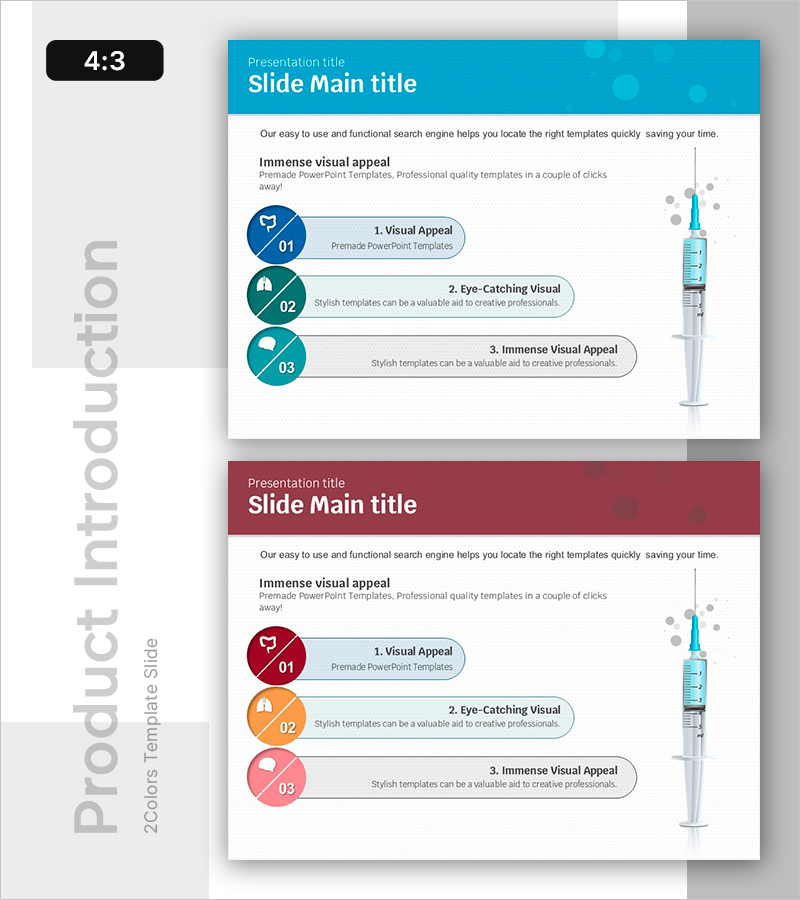
A closed-form diagram PowerPoint slide featuring three circular nodes in contrasting blue, orange, and cyan colors. Each node contains an icon, number, title, and descriptive text, clearly distinguishing each step. A syringe mockup image positioned on the right provides visual context ideal for pharmaceutical, medical device, and biotech product presentations and development planning. Delivered as a 2-slide set in 4:3 aspect ratio, fully editable PPTX format.
Usage Points
-
Main Usage
Visualizes three sequential steps or processes using circular nodes to enhance audience comprehension. Color-coded nodes with icons intuitively convey stage-specific characteristics, specializing in explaining product features, development stages, and mechanisms of action in medical, pharmaceutical, and biotech sectors.
-
How to Use
Open with a title slide introducing the main concept, then present the 3-step diagram slide detailing each stage. Edit node text and icons to match your content, and replace the right-side mockup image with product photos or graphs as needed.
-
Recommended For
Recommended for medical device and pharmaceutical company product presentations, biotech startup pitch decks, hospital and clinic treatment process explanations, clinical trial result reports, and medical education seminars. Particularly suited for presentations requiring 3-step processes or stage-by-stage analysis in medical and scientific fields.
-
Slide Structure
Slide 1: Cyan header with title + body text + 3 circular nodes (blue, orange, cyan) + right-side syringe mockup image. Each node includes number (01, 02, 03), icon, title, and descriptive text in speech bubble format. Slide 2: Identical layout with burgundy header variant for color flexibility.
Related Products
-

Science Icon and Connection Text Box – Ease of Information Delivery
#Product/Service Introduction #Diagram #Product/Service Introduction
-

Road Freight Volume Visualization Truck Graph – Logistics Market Analysis
#Product/Service Introduction #Market and Competitor Analysis #Diagram
-

Product Service Introduction Diagram – Effective Communication
#Product/Service Introduction #Diagram #Product/Service Introduction
-

Cluster Diagram Visualizing Business Overview
#Product/Service Introduction #Diagram #Other
