Lesson Management Outcome Diagram – Visualizing Business Strategies
RB0300043_6
- Last Update 03/11/2025
- File Size 0.5MB
- # of Slides 2
- File Format PPTX
- Slide Ratio 4:3
- Color
Keywords
- #Content-Based Slides
- #Design-Based Slides
- #Business Strategy
- #Operational Plan
- #Diagram
- #Achievements
- #Risk Management
- #Spread
- #Centralized Diagram
- #4:3
- #radial diagram PowerPoint
- #central hub diagram slide
- #4-point strategy visualization
- #business strategy diagram template
- #performance management PowerPoint slide
About the Product
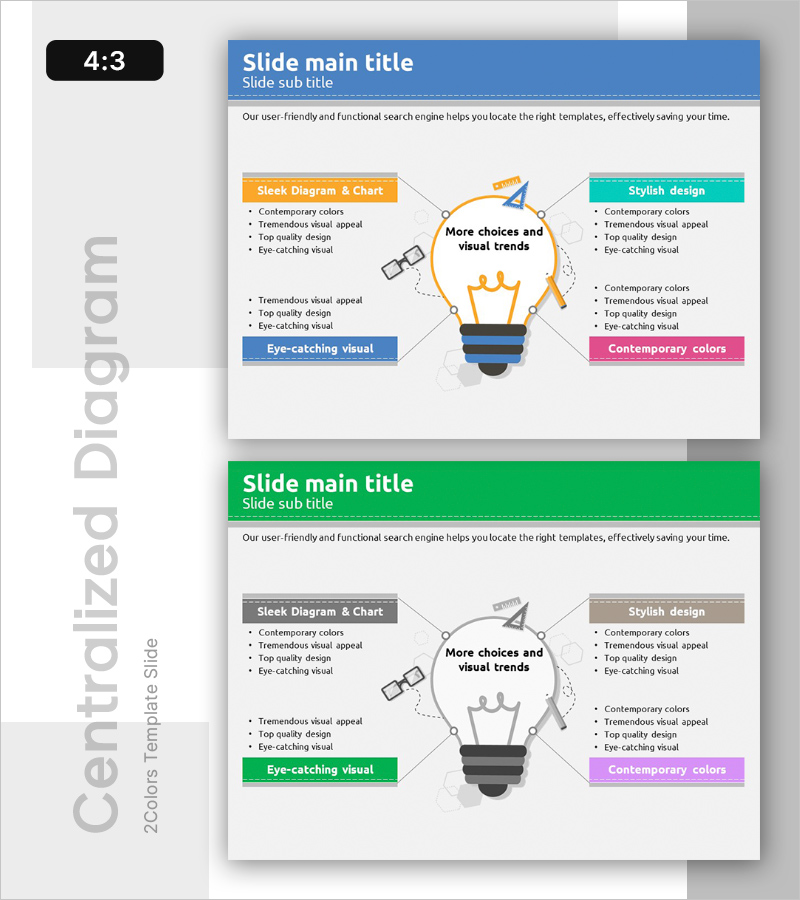
A radial diagram PowerPoint slide that visualizes business strategies and performance management by expanding four directional elements from a central hub. The orange circular center node branches outward with arrows in four directions, each connected to colorful text boxes in orange, blue, teal, and pink that highlight distinct strategic areas. The 2-slide set provides identical layouts with varied color combinations, ready for immediate use in presentations on operational planning, risk management, organizational strategy, and business performance reporting.
Usage Points
-
Main Usage
Positions an organization's core objective or strategy at the center, with four supporting strategic initiatives, implementation tasks, or performance indicators radiating outward. Effectively communicates multi-layered information structures for business strategy, performance management, operational planning, and risk management in a single visual.
-
How to Use
Enter the core topic (e.g., business objective, performance metric, strategic direction) in the central circular node. Fill the four text boxes with detailed items, descriptions, responsible parties, and timelines. Use in executive briefings, strategy meetings, organizational presentations, and performance reviews.
-
Recommended For
Executives, business managers, strategic planning teams, operations managers, and project leaders. Ideal for business plans, performance reports, strategy presentations, organizational restructuring announcements, and risk management plans.
-
Slide Structure
2-slide set. Each slide features a central orange circular node with arrows extending in four cardinal directions, each terminating in a colored text box (orange, blue, teal, pink). First slide has blue header; second slide features green header with color variation for visual diversity.
Related Products
-

Interior Quotation and Construction System – Harmonizing Design and Operations
#Operational Plan #Diagram #Business Processes
-

Visualizing Operations Plan with Circular Circulation Diagram – Risk Management Strategy
#Operational Plan #Diagram #Production and Technology Development Strategy
-

Eco-friendly Business System Structure – Blue Green Diagram
#Operational Plan #Technical Approach #Diagram
-

Key Business Risks & Response Framework Slide – Integrated Risk Control
#Operational Plan #Diagram #Risk Management
