Cloud Service Area Classification – Diagram for Business Introduction
RB0200023_4
- Last Update 03/09/2025
- File Size 0.6MB
- # of Slides 2
- File Format PPTX
- Slide Ratio 4:3
- Color
Keywords
- #Content-Based Slides
- #Design-Based Slides
- #Product/Service Introduction
- #Business Introduction
- #Diagram
- #Product/Service Introduction
- #Business Areas
- #Spread
- #Centralized Diagram
- #4:3
- #radial diagram PowerPoint
- #hub-and-spoke diagram slide
- #3-node expansion slide
- #cloud service diagram PowerPoint
- #business introduction PPT slide
About the Product
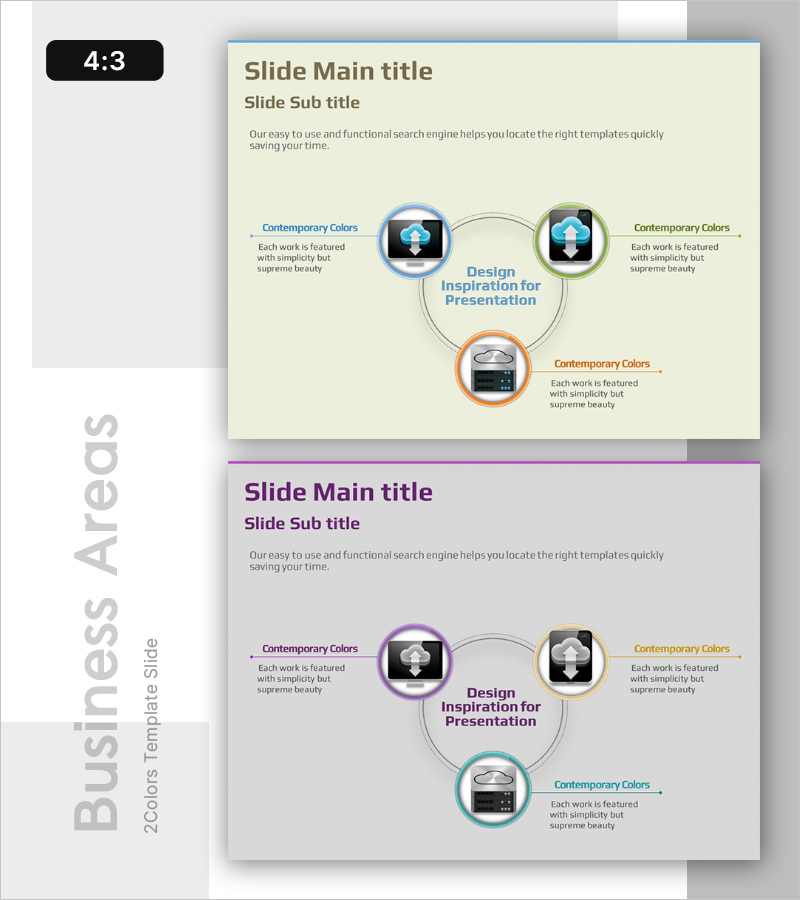
A radial diagram PowerPoint slide that expands from a central core concept to three directional nodes. This design is optimized for visualizing cloud service area classification, business introduction, and service category explanation. The structure features a central circular node connected to three outer nodes, each distinguished by colored borders (blue, green, orange) to clarify information hierarchy. Icons and text labels are positioned at each node for immediate use in business presentations, company introductions, and product overview decks. The 4:3 aspect ratio with 2-slide composition adapts flexibly to various presentation scenarios.
Usage Points
-
Main Usage
Visualizes information structures that radiate from a central concept to three or more peripheral items. Effectively represents cloud service classification, business area explanation, product category analysis, and organizational function breakdown with clear center-to-periphery relationships.
-
How to Use
Enter the core concept (e.g., Cloud Services) in the central circular node and place detailed items (e.g., IaaS, PaaS, SaaS) in the three directional nodes. Edit text and icons in each node to customize the diagram for your presentation topic.
-
Recommended For
Ideal for IT and cloud service companies presenting business explanations, technology architecture overviews, and product portfolio introductions. Also suitable for organizational structure, business area, and service classification discussions in executive reports, investor presentations, and client proposals.
-
Slide Structure
Comprises one central circular node (core concept) with three outer circular nodes (detailed items) positioned radially. Each node features a distinct colored border (blue, green, orange), connected to the center by linear paths that express hierarchical relationships. Text labels and icons at each node enhance information delivery and visual clarity.
Related Products
-

Water Resources Diagram Template for Business Success
#Product/Service Introduction #Business Introduction #Diagram
-

Farming Harvest Business Differentiation Strategy Diagram
#Product/Service Introduction #Business Introduction #Diagram
-

Social Network Diagram Template – Modern Business Introduction
#Product/Service Introduction #Business Introduction #Diagram
-

Visual Presentation of Furniture Characteristics by Category
#Product/Service Introduction #Business Introduction #Diagram
