Performance Strategies Presentation Template – Vision for Increasing Sales
RB0100039_6
- Last Update 03/05/2025
- File Size 0.7MB
- # of Slides 2
- File Format PPTX
- Slide Ratio 4:3
- Color
Keywords
- #Content-Based Slides
- #Design-Based Slides
- #Business Vision and Strategy
- #Technical Approach
- #Diagram
- #Business Strategy
- #Future Development Roadmap
- #Flow
- #Cluster
- #Multidirectional Flow
- #Closed Cluster Diagram
- #4:3
- #closed-loop diagram PowerPoint
- #4-node diagram slide
- #strategy visualization PowerPoint
- #business diagram template
- #performance strategy presentation slide
About the Product
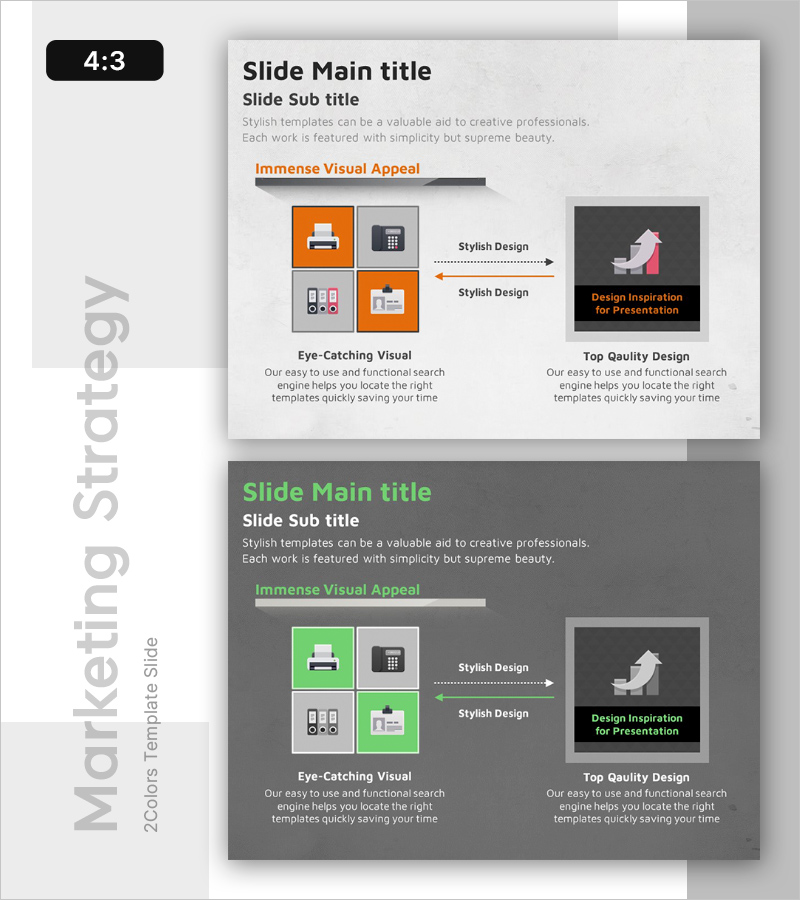
A 4-node closed-loop diagram PowerPoint slide designed to visualize performance strategies and interconnected business processes. The orange and gray color contrast emphasizes key elements, while central arrows clarify the relationship between strategic components. This presentation slide is ready to use for business strategy, performance management, and technology department presentations, transforming complex processes into simple, intuitive visuals. Delivered in editable PPTX format with 2 slides in 4:3 aspect ratio.
Usage Points
-
Main Usage
Connects four core strategic elements in a closed-loop structure to emphasize mutual relationships and cyclical processes. Clearly communicates strategic interdependencies for achieving performance goals, making it ideal for executive strategy meetings and performance reporting.
-
How to Use
Enter strategy item names in each node and use central arrows to indicate mutual influence relationships. Place key performance indicators (KPIs) in orange-highlighted areas to visualize priorities. Adaptable for marketing strategies, technology roadmaps, organizational role distribution, and other strategic frameworks.
-
Recommended For
Executives, strategy managers, project managers, technology leaders, and marketing professionals presenting strategy meetings, quarterly performance reports, and business plan presentations. Particularly effective when explaining multiple interconnected strategies simultaneously.
-
Slide Structure
Four nodes arranged in square formation (top-left, top-right, bottom-right, bottom-left) connected by bidirectional central arrows. Top-left and bottom-right nodes feature orange accent backgrounds, while top-right and bottom-left use gray for contrast. A separate emphasis box on the right (black background with orange text) allows additional key message placement.
Related Products
-

Red Blue Strategy Diagram - Business Vision and Future Development
#Business Vision and Strategy #Technical Approach #Diagram
-

Visualizing Strategic Flow with Encountering Arrow Diagram
#Product/Service Introduction #Business Vision and Strategy #Diagram
-

Eco-Energy Strategies on the Global Stage
#Business Vision and Strategy #Corporate Social Responsibility #Diagram
-

Main Key Keyword Strategy Diagram – Visualizing Business Goals and Vision in a Cluster
#Business Vision and Strategy #Diagram #Business Strategy
