Global Currency Trends & Rate Analysis – Data-driven Strategic Insights
RB0100027-1_8
- Last Update 03/03/2025
- File Size 2.1MB
- # of Slides 2
- File Format PPTX
- Slide Ratio 4:3
- Color
Keywords
About the Product
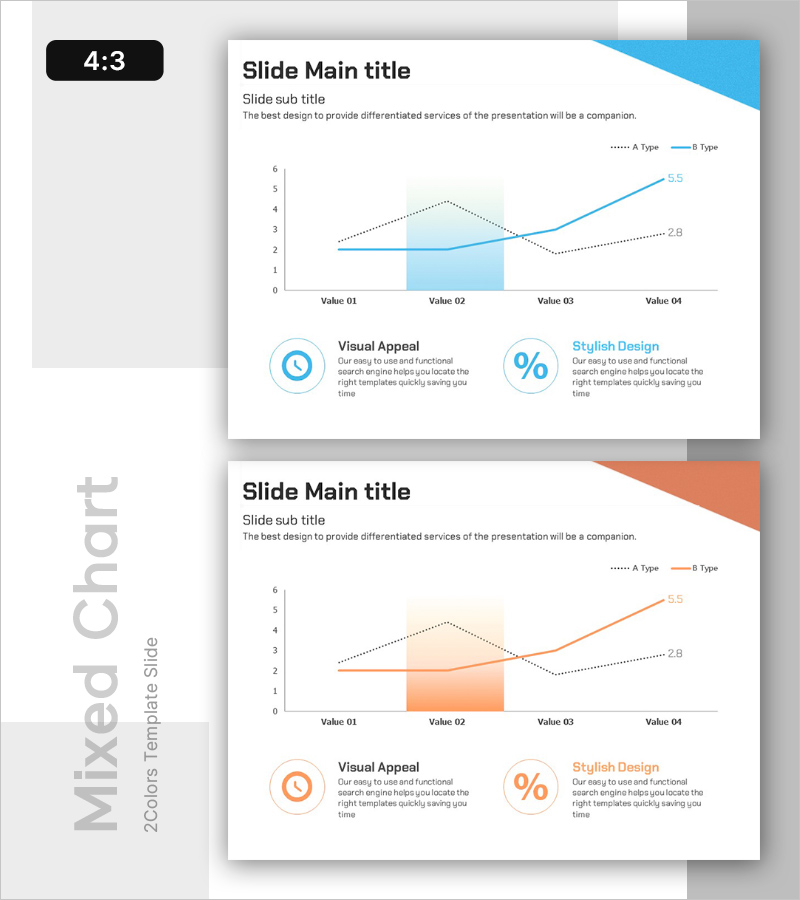
A PowerPoint slide template featuring a dual-line chart that compares data trends across two series (A Type and B Type) at four time points (Value 01 through Value 04). The design includes a highlighted background area to emphasize a critical data segment, making trend analysis visually intuitive. Two color variants—blue and orange—allow you to select the palette that best matches your presentation theme. Each slide incorporates icon-based callout boxes labeled Visual Appeal and Stylish Design to provide context and interpretation. This template is ideal for presenting time-series data, performance comparisons, market trends, and strategic insights in business presentations, reports, and investor decks.
Usage Points
-
Main Usage
Visualize and compare the evolution of two or more variables over time, enabling stakeholders to identify trends, inflection points, and performance gaps. Commonly used for revenue growth, customer satisfaction metrics, market share evolution, currency trends, and competitive benchmarking.
-
How to Use
Replace the sample data with your actual values; the line chart updates automatically. Modify the legend labels (A Type and B Type) and axis labels (Value 01–04) to reflect your time periods (months, quarters, years). Adjust the background highlight area to emphasize critical data ranges or turning points.
-
Recommended For
Financial reports (quarterly/annual performance), marketing strategy presentations (market trend analysis), business plans (revenue forecasts), executive summaries, investor pitch decks, consulting proposals (competitive analysis), and operational dashboards requiring trend comparison.
-
Slide Structure
Dual-line chart with 4 data points per series (A Type dotted line, B Type solid line) + background highlight zone (Value 02 segment) + 2 icon-based text callouts (Visual Appeal and Stylish Design) + legend. Includes 2 slides: blue-themed and orange-themed variants for color flexibility.
Related Products
-

Automotive Promotion and Pricing Strategies Slide – Market Flow Theme
#Marketing Plan and Strategy #Diagram #Pricing Strategy
-

Interior Product Promotion Strategy – Classic Diagram
#Marketing Plan and Strategy #Diagram #Pricing Strategy
-

Sales Plan for Entering the Global Market Template
#Marketing Plan and Strategy #Diagram #Pricing Strategy
-

Line Chart to Visualize Real Estate Sales Trends – Market Analysis Strategy
#Marketing Plan and Strategy #Financial Plans and Performance #Graph
