Yearly Career Advancement Plan – Business Implementation Strategy
RB0100006_5
- Last Update 03/01/2025
- File Size 0.3MB
- # of Slides 2
- File Format PPTX
- Slide Ratio 4:3
- Color
Keywords
- #Content-Based Slides
- #Design-Based Slides
- #Business Strategy
- #Business Management
- #Diagram
- #As-Is To-Be
- #Implementation Schedule
- #Cluster
- #Chain Diagram
- #4:3
- #timeline diagram PowerPoint
- #3-stage flowchart slide
- #year-over-year plan template
- #radial diagram PowerPoint slide
- #business strategy presentation
About the Product
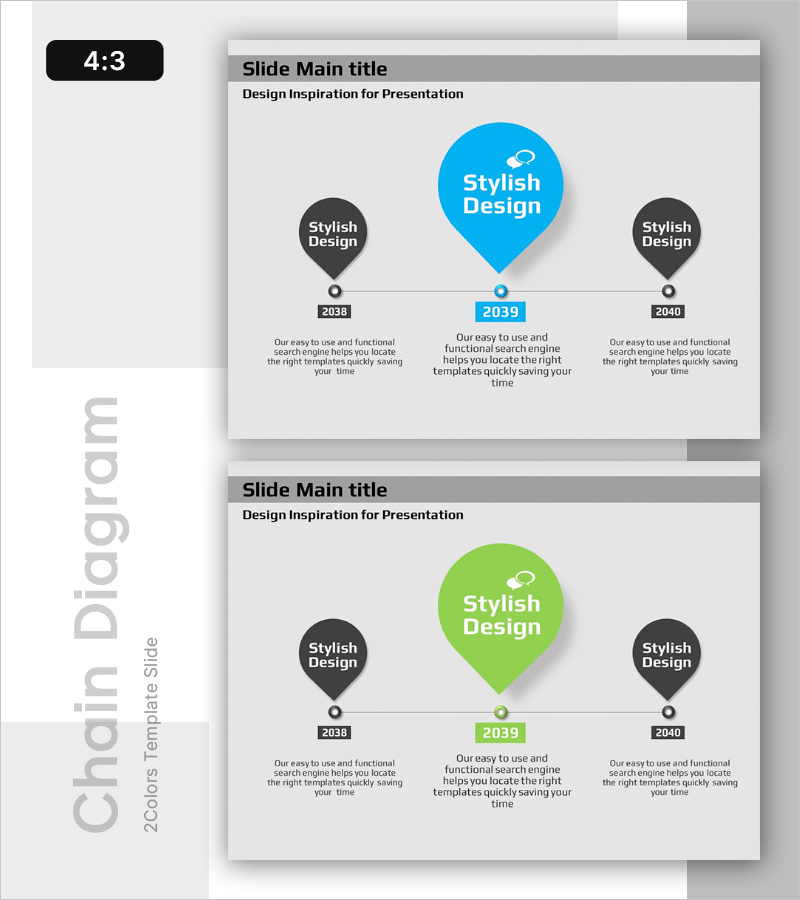
A radial timeline diagram PowerPoint slide that visualizes year-over-year progress and strategic milestones. The design features a large central circular node with two smaller nodes on either side, creating a balanced three-point timeline layout. The blue and charcoal color scheme emphasizes professionalism and clarity, while year labels and descriptive text areas below each node allow for easy customization. This 4:3 aspect ratio, 2-slide template is ready for immediate use in business presentations, strategy reviews, and progress reports.
Usage Points
-
Main Usage
Communicate career advancement, business implementation phases, or strategic roadmaps across three distinct time periods. The central node highlights the primary objective or key achievement, while flanking nodes represent preceding and subsequent phases. This hierarchical structure enables executives, team members, and stakeholders to quickly grasp progress milestones and strategic direction.
-
How to Use
Enter year labels and milestone descriptions in the text areas below each node. Place your primary goal or major achievement in the central circle, with supporting phases or sequential steps in the left and right circles. Customize node colors to indicate priority levels, and add connecting arrows or lines to show cause-and-effect relationships between stages.
-
Recommended For
Ideal for executives, project managers, and HR professionals presenting mid-term strategies, talent development plans, or business expansion roadmaps. Effective in investor presentations, board meetings, team workshops, and training seminars where time-based progress visualization is essential.
-
Slide Structure
Two-slide template with identical 3-stage timeline diagrams in different color variations: blue accent and green accent versions. Each slide contains one large central circle (approximately 120px diameter), two smaller circles (approximately 80px diameter) on left and right, three year-label boxes, and three descriptive text areas, optimized for 4:3 aspect ratio.
Related Products
-

Social Network STEP4 Schedule Planning Diagram
#Business Strategy #Business Management #Diagram
-

Marketing Effectiveness Analysis Slide – Cluster Diagram for Operational Planning
#Business Management #Operational Plan #Diagram
-

Marketing Effectiveness Analysis Diagram – A Visual Overview for Effective Business Execution!
#Business Management #Operational Plan #Diagram
-

Travel Business Future Development Plan and Outlook Diagram
#Business Strategy #Business Management #Diagram
