Market Share Donut Pie Chart – Company Vision and Values
RB0100001_5
- Last Update 02/28/2025
- File Size 4.2MB
- # of Slides 2
- File Format PPTX
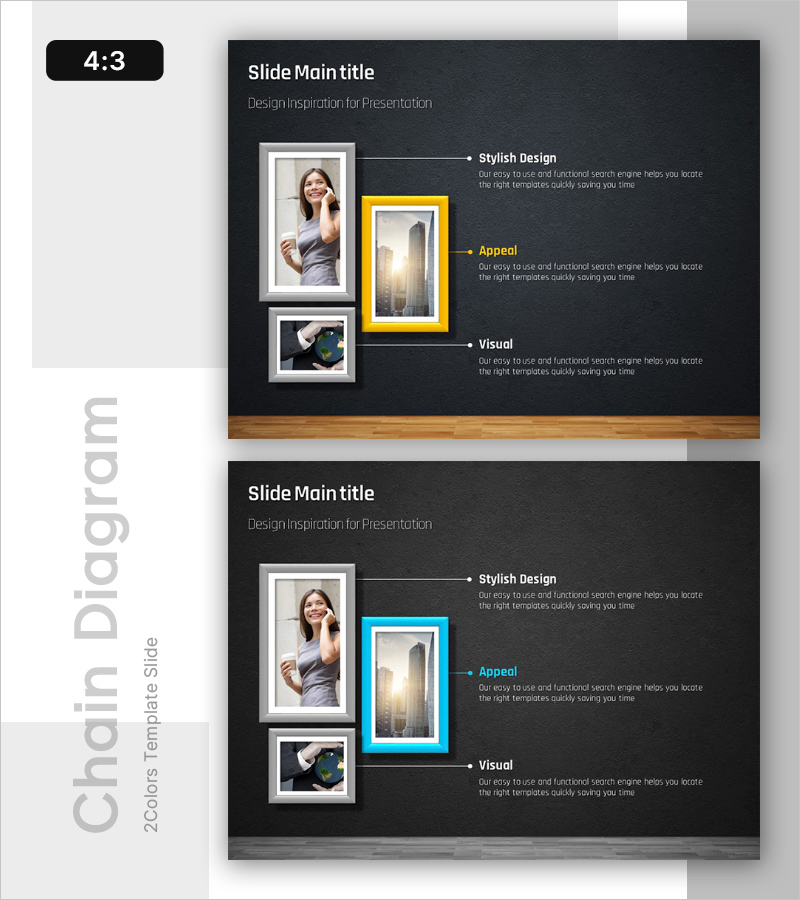
- Slide Ratio 4:3
- Color
Keywords
About the Product
A professional PowerPoint slide featuring a donut pie chart to visualize market share and competitive positioning. This 2-slide set uses a dark background with white, yellow, and cyan accent colors arranged in a left-right layout: three framed images on the left connected via arrows to three text blocks on the right. Ideal for company presentations, investor pitches, and strategic business reports. The donut chart segments are fully editable to input real market data, and the text areas accommodate company vision, core values, and growth direction. Provided in 4:3 aspect ratio PPTX format, optimized for market analysis and competitive advantage sections in corporate presentations.
Usage Points
-
Main Usage
Communicate market share, competitive advantage, and business vision to investors, partners, and stakeholders using a clear donut chart visualization. Strengthens credibility in company presentations, business plans, and investor relations materials by presenting data-driven market analysis.
-
How to Use
Input actual market share percentages into each donut chart segment, then add strategic insights and competitive strengths in the right-side text blocks. Replace the left-side image frames with product photos, team pictures, or service visuals to enhance visual credibility. Colors are fully customizable to match corporate branding.
-
Recommended For
Recommended for executives, marketing teams, and sales professionals presenting market positioning. Ideal for investor pitch decks, partnership proposals, quarterly business reviews, and B2B company presentations where demonstrating market leadership is critical.
-
Slide Structure
Two-slide set with consistent layout: left side contains three image frame areas (editable), right side has three text blocks (title, description, additional info). The donut chart supports 3–4 segments with adjustable colors and proportions. All elements are grouped for easy repositioning while maintaining design integrity.
Related Products
-

Structure and Characteristics of Plant Growth Stages – Technical Insight
#Technical Approach #Market and Competitor Analysis #Diagram
-

Step-by-Step Pathway to the Final Learning Goal
#Business Vision and Strategy #Technical Approach #Diagram
-

Circular Gradient Wide Template Diagram2
#Business Management #Technical Approach #Diagram
-

Process Flow and Derivative Insight – Efficient Operational Planning Diagram
#Operational Plan #Technical Approach #Diagram
