Product Segmentation Analysis Diagram & Chart – Stylish Design
RM0700003_16
- Last Update 02/26/2025
- File Size 1.1MB
- # of Slides 2
- File Format PPTX
- Slide Ratio 16:9
- Color
Keywords
- #Content-Based Slides
- #Design-Based Slides
- #Product/Service Introduction
- #Market and Competitor Analysis
- #Diagram
- #Differentiation Strategy for Products/Services
- #Competitor Analysis
- #Cluster
- #Table
- #Chain Diagram
- #Standard Table
- #16:9
- #Venn diagram PowerPoint
- #product differentiation analysis slide
- #competitive comparison template
- #market positioning diagram
- #overlapping circle chart PPT
About the Product
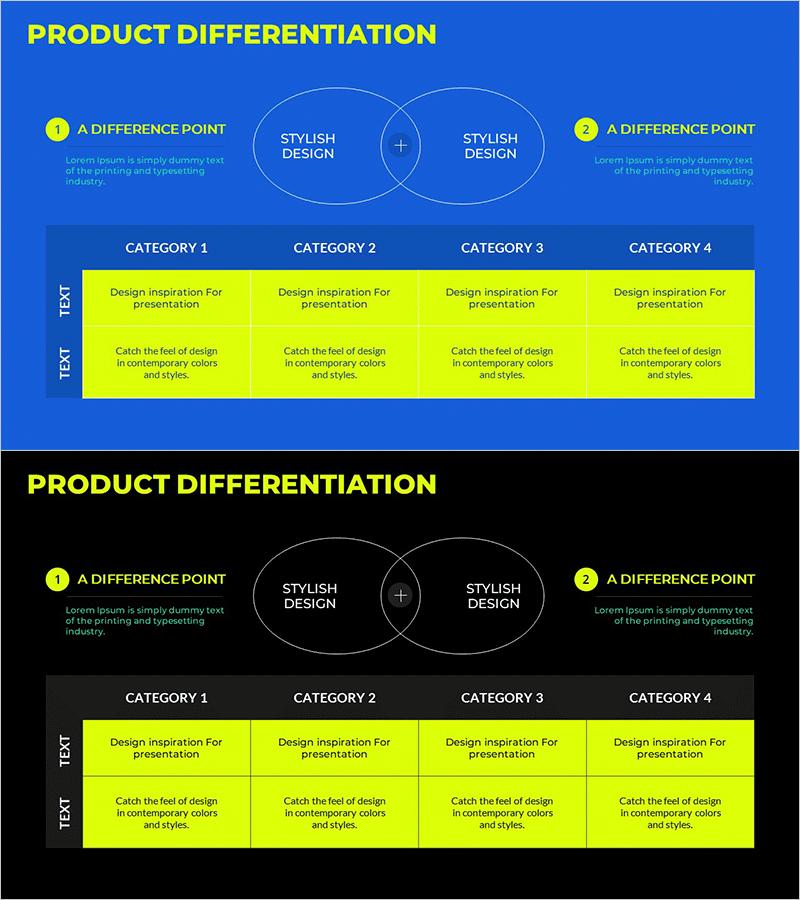
A PowerPoint slide template for visualizing product segmentation and differentiation strategy using a Venn diagram structure. Two overlapping circles represent stylish design elements with intersection points, while left and right nodes highlight key difference points. The bright blue background contrasts with white-bordered circular shapes and yellow accent boxes to enhance information clarity. Four category sections with text input areas enable immediate use for competitive analysis, market positioning, and product feature comparison. Provided in 16:9 widescreen PPTX format for seamless integration into presentations.
Usage Points
-
Main Usage
Clearly distinguish commonalities and differences between two products or services using a Venn diagram format. The left and right nodes present differentiation points while the central intersection area highlights competitive advantages and market positioning at a glance.
-
How to Use
Apply in market analysis sections of marketing plans, product introduction decks, and business reports. Input company product characteristics in the left node, competitor characteristics in the right node, and shared strengths in the central intersection to visualize positioning strategy.
-
Recommended For
Marketing managers, strategic planning teams, and executives presenting competitive analysis and product differentiation strategies. Ideal for investor pitch decks, new product launch presentations, and business strategy meetings requiring data-driven decision support.
-
Slide Structure
Two-slide set. First slide features a blue background with two overlapping circular shapes (Venn diagram), two side nodes, and a central intersection area. Second slide contains four category sections with yellow background and text input areas for adding detailed information.
Related Products
-

In-Depth Analysis of Competitive Products – Maximize Market Understanding
#Product/Service Introduction #Market and Competitor Analysis #Diagram
-

Stylish Bar Chart Slide Design
#Market and Competitor Analysis #Diagram #Graph
-

Carbon Neutral Service Differentiation Strategy Infographic Slide – Style and Benefits
#Product/Service Introduction #Diagram #Differentiation Strategy for Products/Services
-

Visualizing Strategic Flow with Arrow Goal Diagram
#Product/Service Introduction #Marketing Plan and Strategy #Diagram
