Core Function Connection Diagram - Cluster Style Data Representation
RM0700001_8
- Last Update 02/25/2025
- File Size 1MB
- # of Slides 2
- File Format PPTX
- Slide Ratio 16:9
- Color
Keywords
About the Product
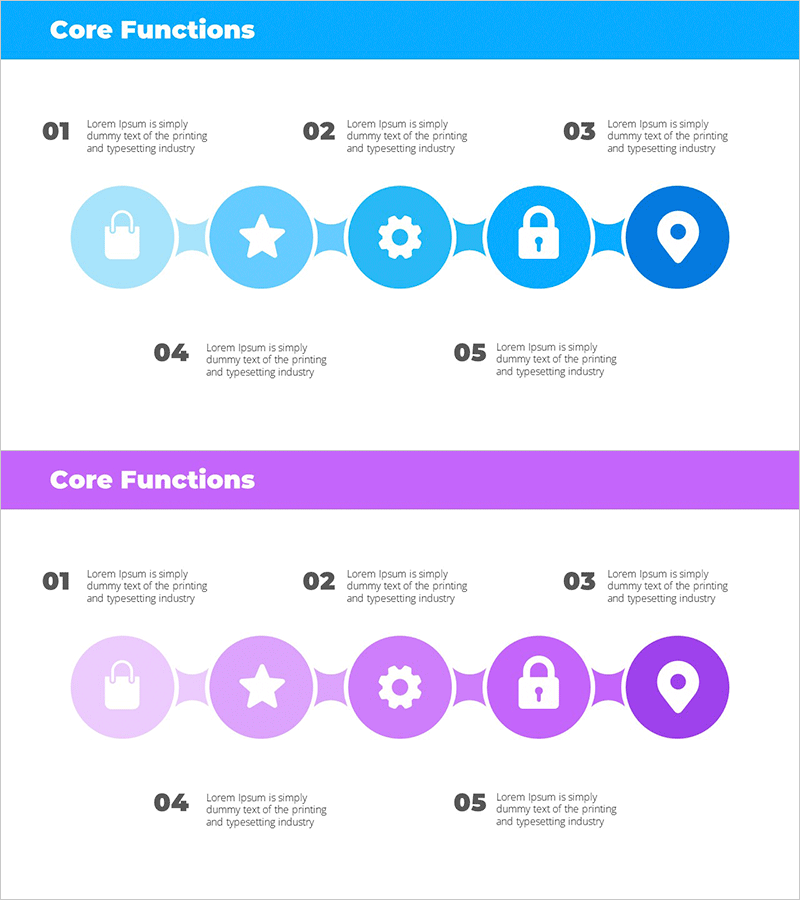
A cluster-style diagram PowerPoint slide that connects five core functions through a central node structure. This slide visualizes relationships and connectivity between functions using a radial layout where the center node connects to four surrounding nodes. Two color versions are provided—one with a light blue to dark blue gradient and another with purple tones—allowing you to match your presentation theme and brand identity. Each node includes an icon placeholder and text input area for product features, service characteristics, organizational roles, or other information. The 16:9 widescreen format includes 2 slides ready for immediate editing.
Usage Points
-
Main Usage
Displays five core functions connected from a central node, expressing functional interdependencies and system integration. Ideal for explaining service architecture, organizational role distribution, business process connections, and system relationships in a clear, visual format.
-
How to Use
Double-click each node's icon and text area to enter function names, descriptions, or roles. Select the color version that matches your presentation theme. Customize node count or text size as needed for your specific content.
-
Recommended For
Product introduction decks, company overview presentations, technical architecture explanations, organizational structure and role distribution talks, business model presentations, and service integration structure explanations. Particularly useful in IT, finance, consulting, and manufacturing industries dealing with complex systems.
-
Slide Structure
2-slide set. Each slide features a 5-node cluster with one central node and four surrounding nodes arranged in a radial pattern. Nodes are circular with icon placeholders and text input areas. Connection lines between nodes represent relationships. Two versions provided: blue gradient and purple tone.
Related Products
-

Tree Forest Infographic Slide Blue Green – Business Strategy Overview
#Product/Service Introduction #Business Strategy #Diagram
-

Key Elements of Early Education Programs – Slides for Creative Thinking
#Product/Service Introduction #Diagram #Features
-

Stylish Section Divider for a Focused Office Mood
#Product/Service Introduction #Diagram #Features
-

Diagram of Key Traits by Dream Field – Creativity and Passion
#Product/Service Introduction #Diagram #Product/Service Introduction
