Fund Management Plan Table Chart – Essential Slide for Financial Performance Analysis
RM0600003_23
- Last Update 02/23/2025
- File Size 0.3MB
- # of Slides 2
- File Format PPTX
- Slide Ratio 16:9
- Color
Keywords
- #Content-Based Slides
- #Design-Based Slides
- #Marketing Plan and Strategy
- #Financial Plans and Performance
- #Diagram
- #Pricing Strategy
- #Capital Requirements
- #Table
- #16:9
- #fund management plan table
- #financial performance analysis slide
- #fund management PowerPoint
- #comparative analysis presentation
- #financial data table
About the Product
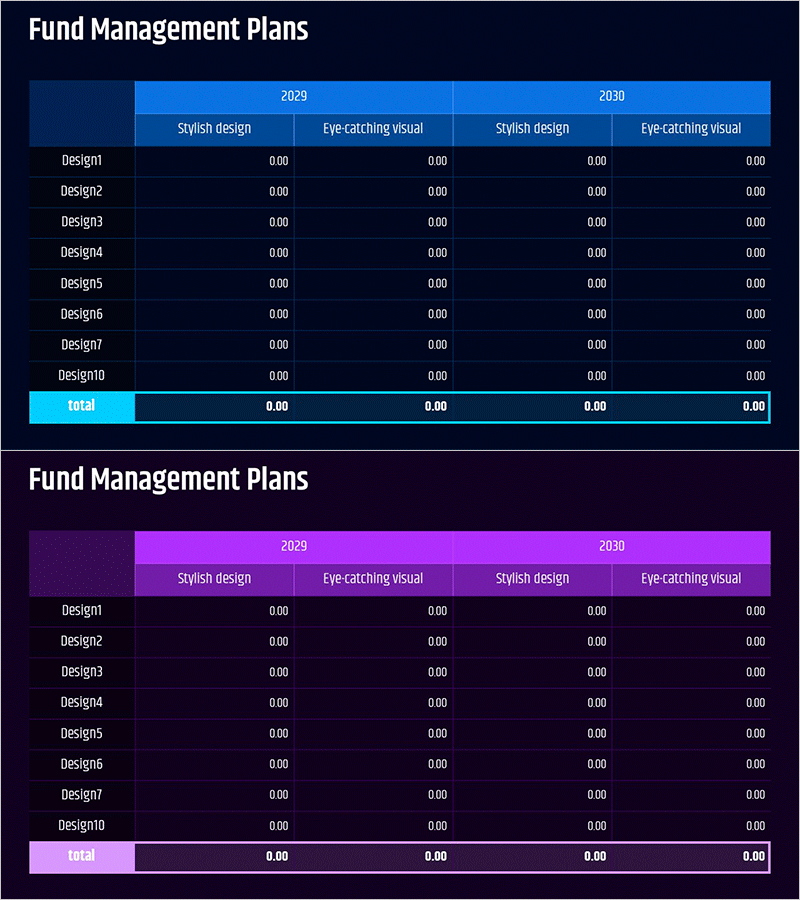
An essential slide for financial performance analysis, presenting fund management plans for 2029 and 2030 with stylish design and eye-catching visuals in a comparative table format. Provided in two color versions—dark navy background with blue header and pink header—each displaying eight design options (Design1~Design10) with stylish design and eye-catching visual columns. This 2-slide PowerPoint set clearly visualizes financial data and is ready to use in investor presentations, IR materials, and financial reports.
Usage Points
-
Main Usage
Compare and analyze year-over-year fund management plans through stylish design and eye-catching visuals. Clearly communicate financial status to investors, executives, and stakeholders with a professional table layout.
-
How to Use
Insert into the financial section of IR materials, financial reports, or business plans to display year-over-year fund management status. Select either the blue or pink color version to match your overall presentation tone.
-
Recommended For
Ideal for CFOs, finance managers, investor relations professionals, and executive presentations. Particularly effective when comparing and analyzing fund management plans, budget status, and financial performance.
-
Slide Structure
Consists of 2 slides, each displaying fund management plans for 2029 and 2030 in a 4-column format (stylish design, eye-catching visual for each year). Eight design rows plus a total row systematically organize financial data.
Related Products
-

Fund Management Plan Table Slide – Financial Planning and Performance
#Marketing Plan and Strategy #Financial Plans and Performance #Diagram
-

Funding Plan Table – Efficient Fund Management
#Marketing Plan and Strategy #Financial Plans and Performance #Diagram
-

Fund Management Plan – A New Vision for Finance
#Marketing Plan and Strategy #Financial Plans and Performance #Diagram
-

Detailed Graph of Fund Management Analysis – Emphasis on Financial Performance
#Marketing Plan and Strategy #Financial Plans and Performance #Diagram
