Smart Business PowerPoint Template – Stylish and Modern Design
B0100076
- Last Update 03/13/2025
- File Size 11.1MB
- # of Slides 20
- File Format PPTX
- Slide Ratio 4:3
- Color
Slide Preview
Keywords
About the Product
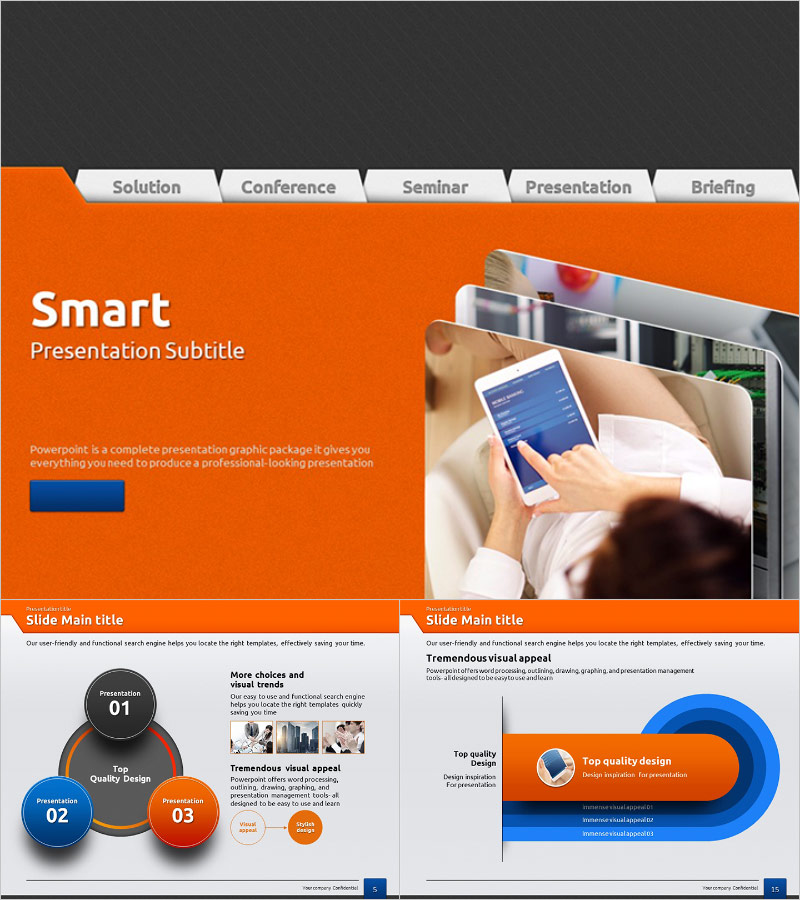
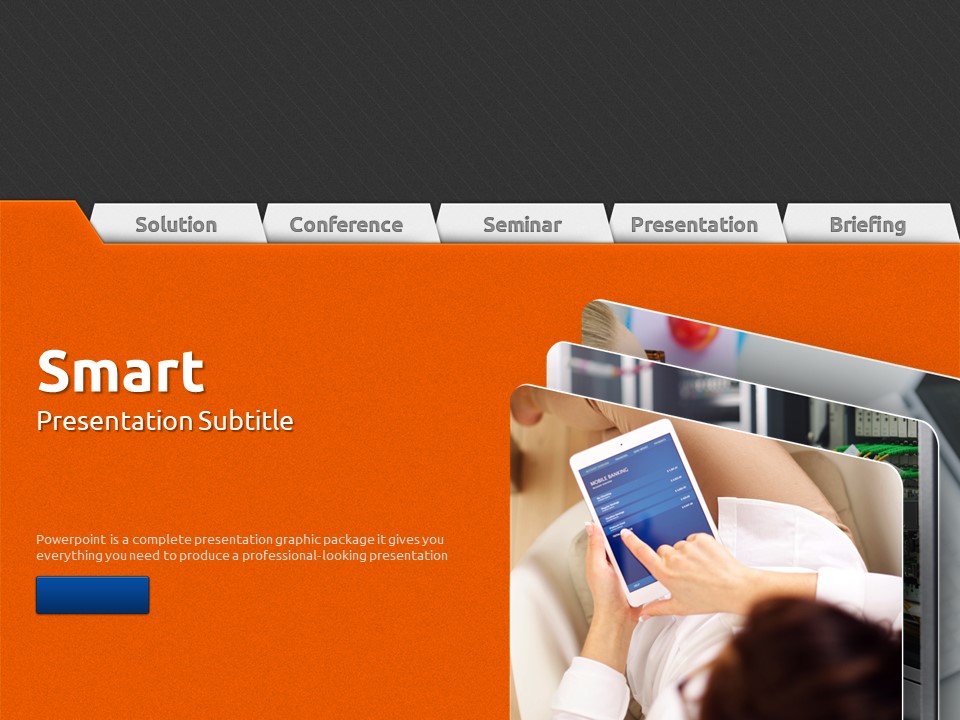
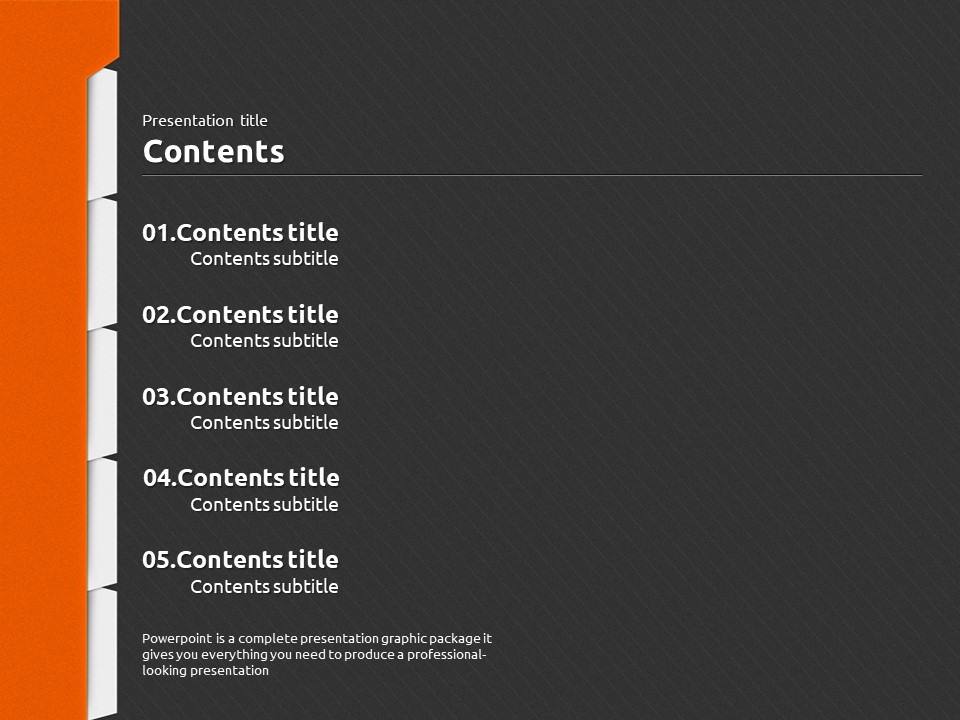
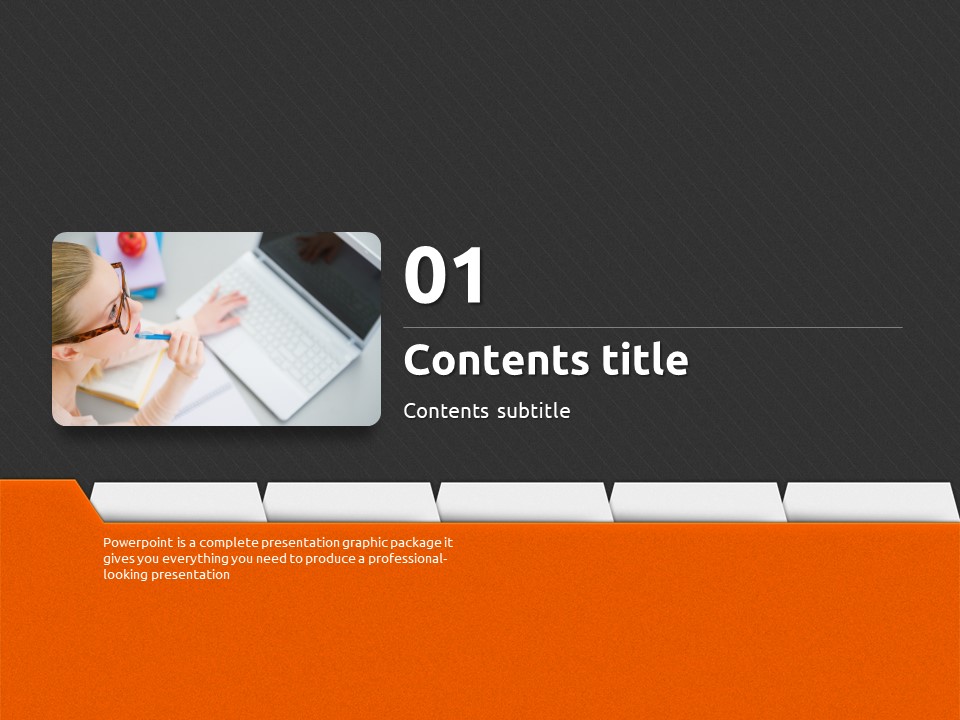
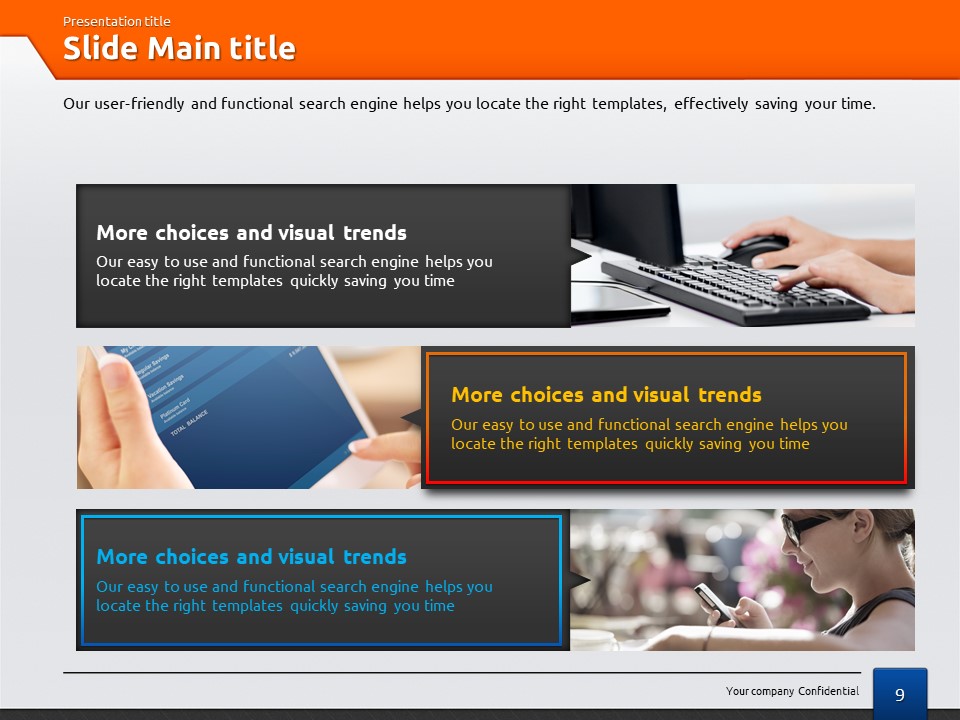
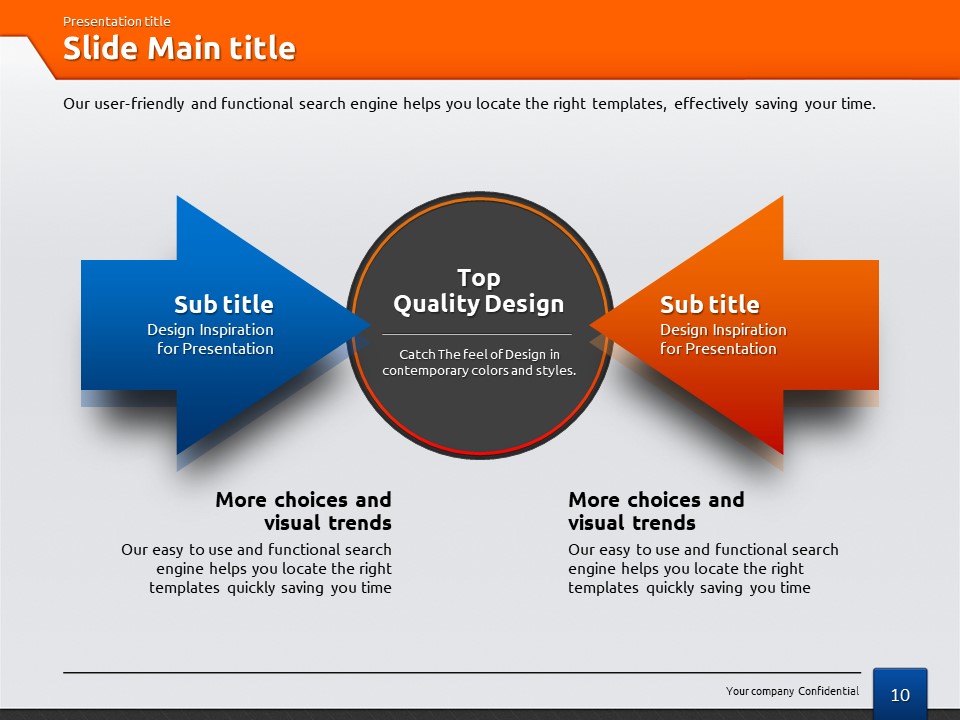
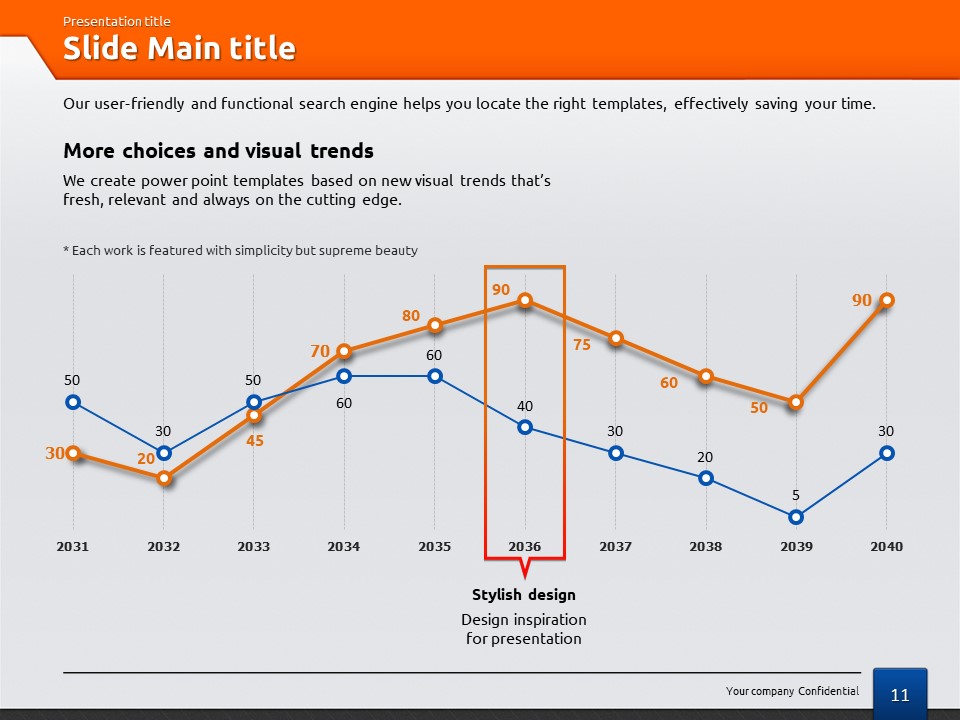
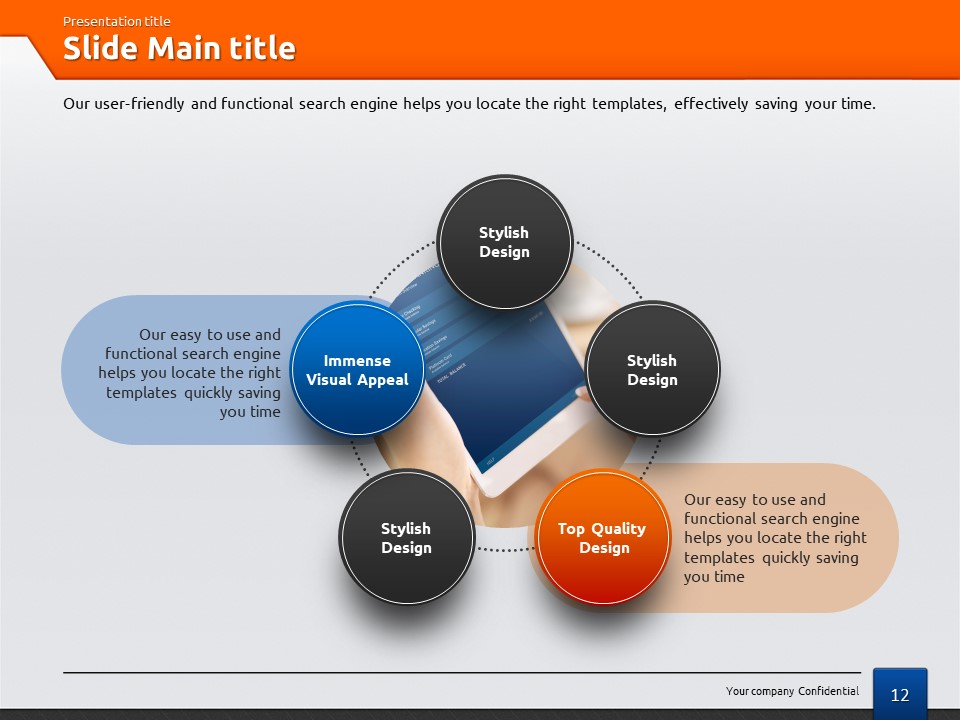
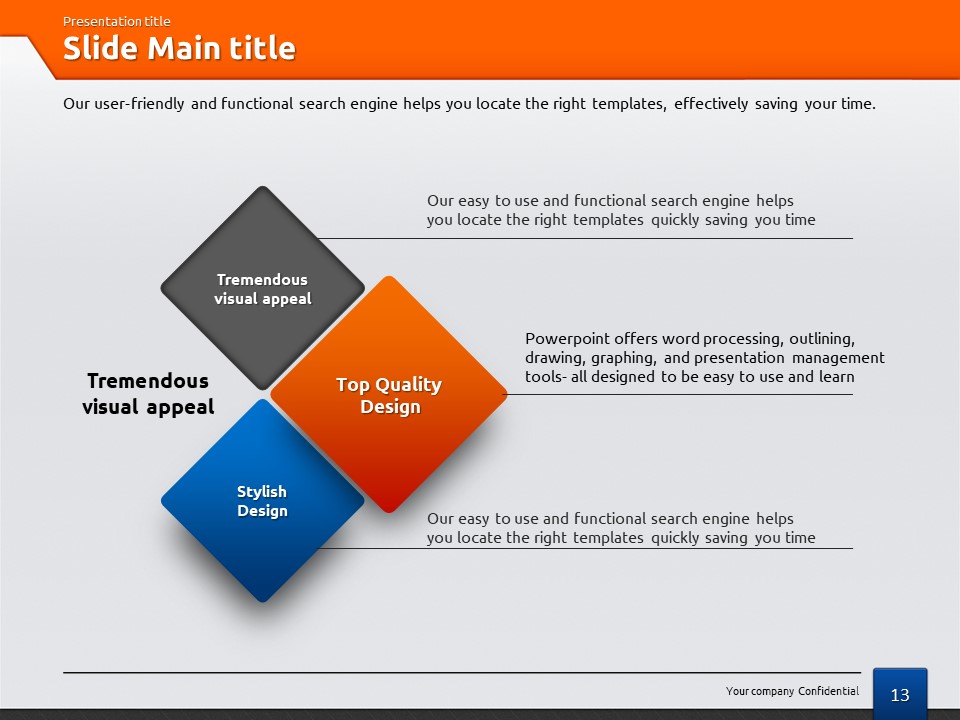
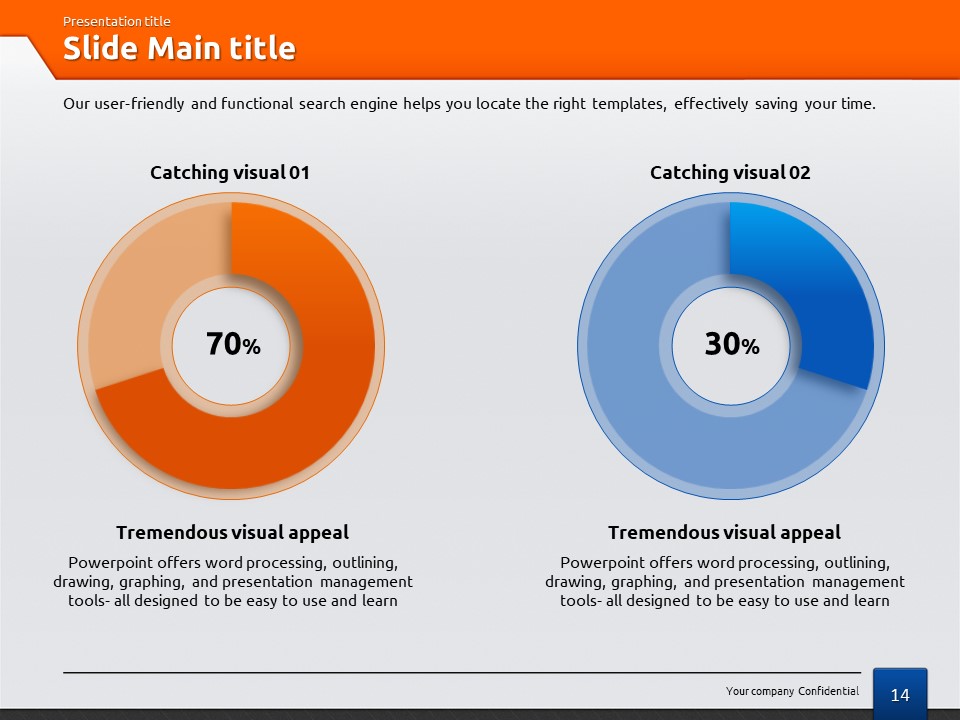
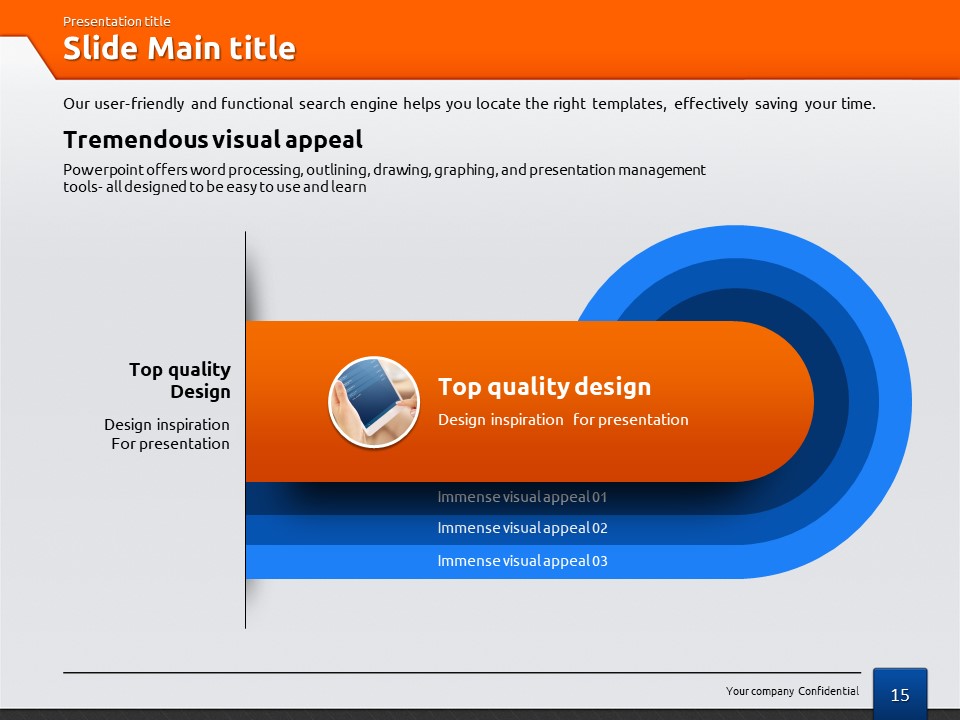
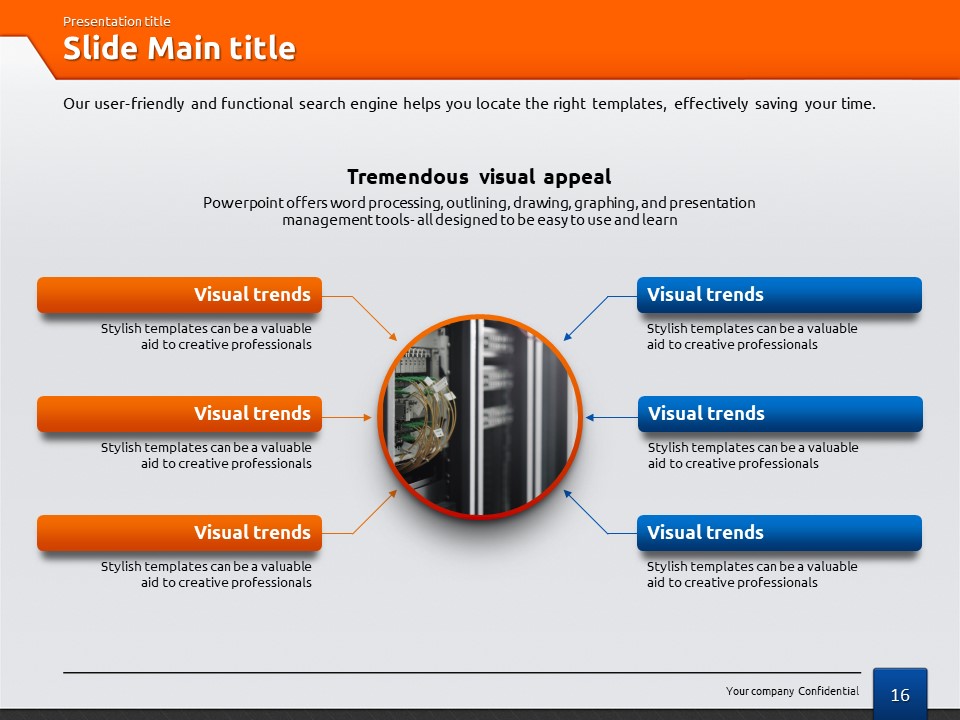
A dynamic business PowerPoint template built on a bold orange and dark charcoal gray color scheme with blue accent highlights. The top tab navigation structure — Solution, Conference, Seminar, Presentation, and Briefing — guides audiences through your presentation flow at a glance. Balanced layouts combine real-device photography with structured text blocks, delivering a confident and professional impression across every slide. This 20-slide PPTX set includes a full-bleed cover slide, mixed text-and-image body slides, a line graph slide for data visualization, and a circular bubble diagram for relationship mapping. All elements — text, colors, and images — are fully editable, making it easy to adapt for product demos, investor briefings, seminar decks, or corporate conference presentations. The 4:3 ratio format ensures compatibility with standard projectors and display screens.
Usage Points
-
Main Usage
Designed for professional business presentations including solution demos, corporate conferences, seminar sessions, and executive briefings where a strong visual identity and clear slide flow are essential.
-
How to Use
Open the PPTX file, replace the tab menu labels and body text with your own content, swap the device photography with your product or service images, and update chart data in the graph slides to match your figures.
-
Recommended For
Sales teams at IT and tech companies, consulting firm presenters, seminar and conference organizers, and business professionals preparing solution proposals or executive briefing decks.
-
Slide Structure
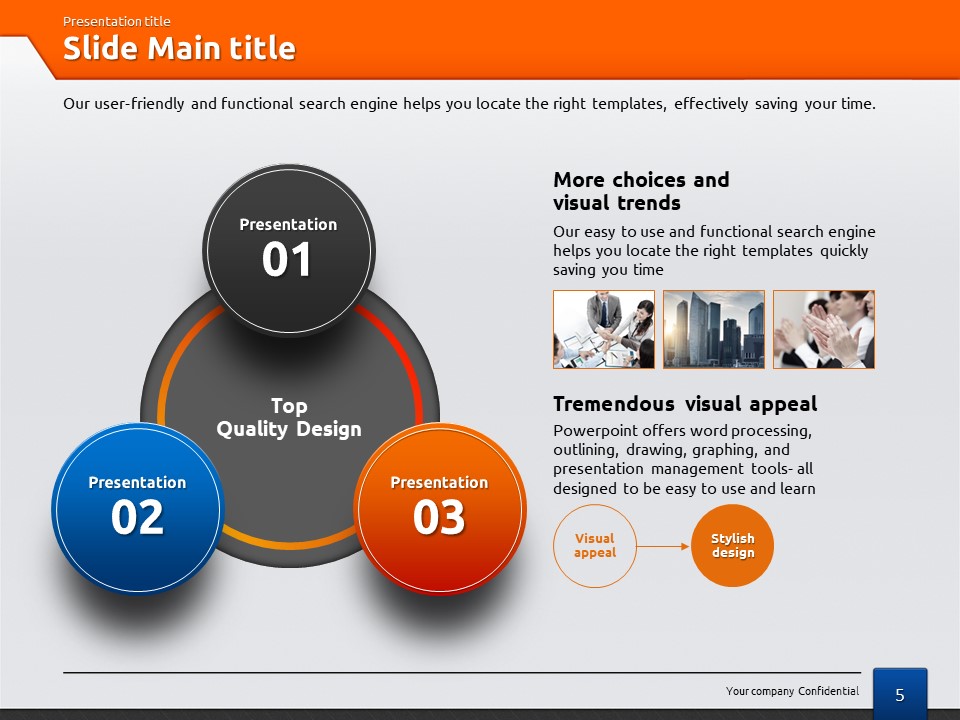
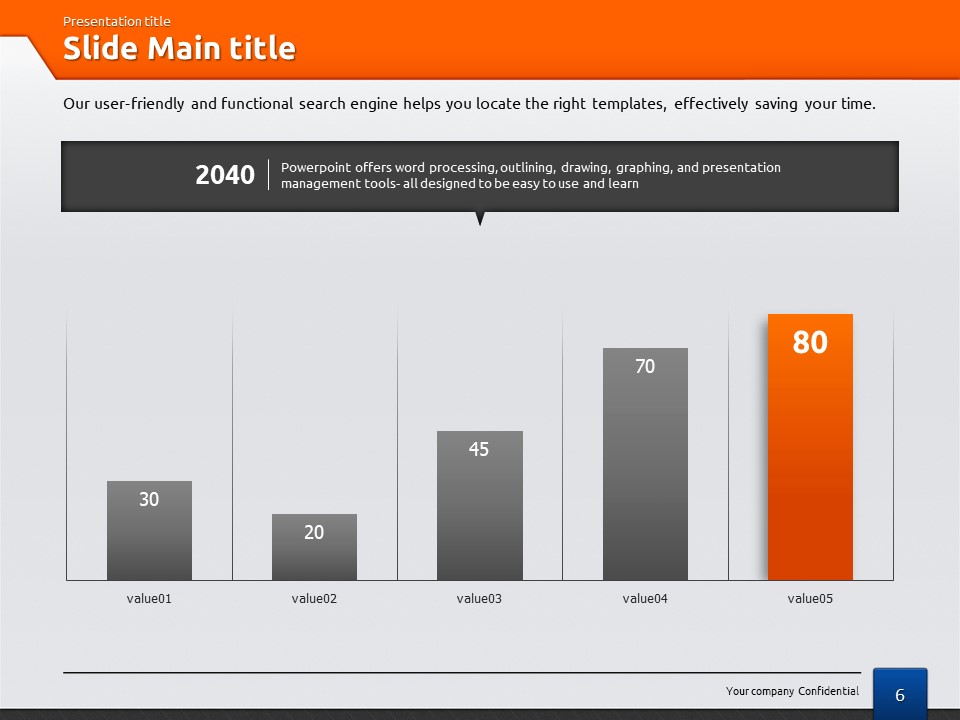
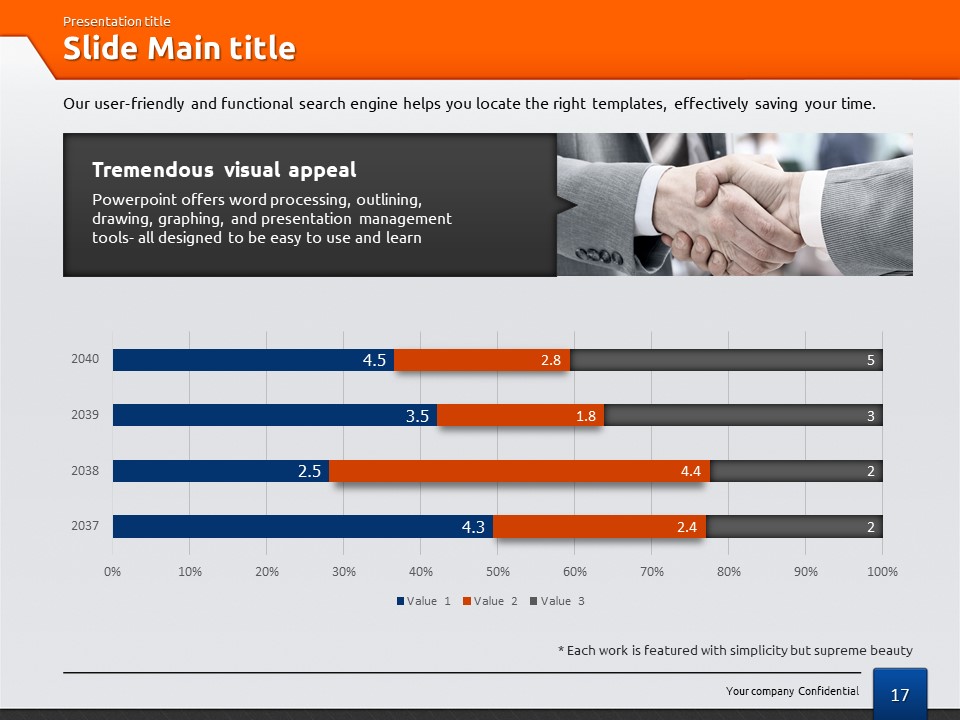
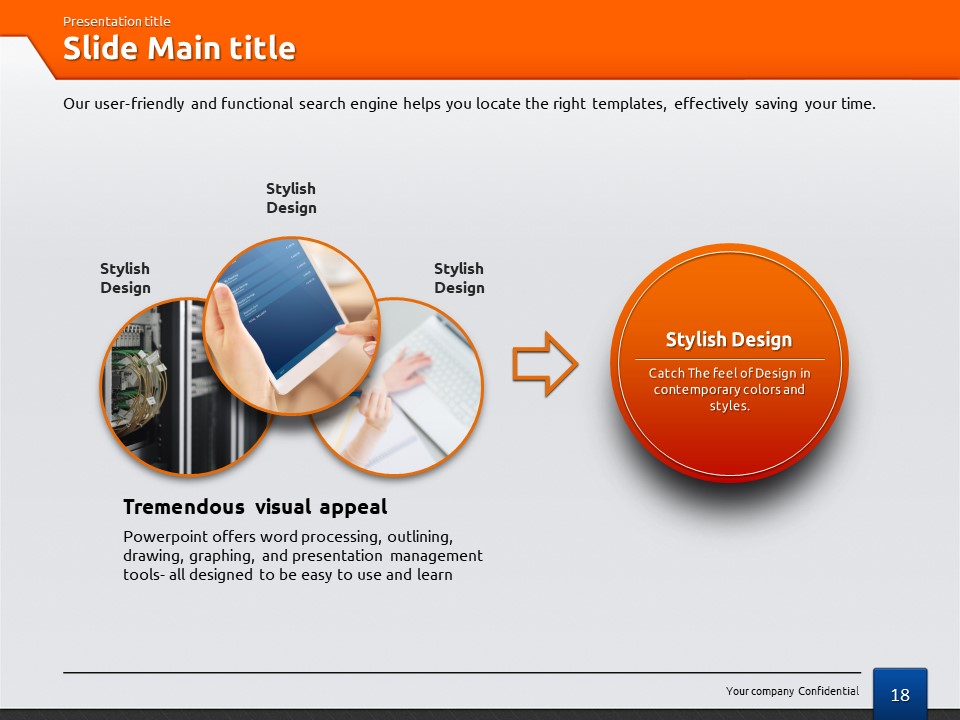
Includes a full-bleed orange cover with device imagery, balanced text-and-image body slides, a 3-node circular process diagram, a multi-line trend graph (slide 11), and a circular bubble relationship map (slide 12), totaling 20 slides.
Related Products
-

Container PPT Wide Template – Efficient Business Presentation Design
#Business
-

Entertainment Company Presentation Template – Stylish and Colorful Design
#Business
-

Multitasking Presentation Template – Optimized Design for Business
#Business
-

Success PowerPoint Wide Design – Professional and Modern Business Template
#Business
