Milestone Table – Essential Tool for Business Strategy
RM0500010_22
- Last Update 02/22/2025
- File Size 0.4MB
- # of Slides 2
- File Format PPTX
- Slide Ratio 16:9
- Color
Keywords
- #Content-Based Slides
- #Design-Based Slides
- #Business Strategy
- #Business Management
- #Operational Plan
- #Diagram
- #Roadmap
- #Implementation Plan
- #Table
- #16:9
- #milestone table PowerPoint
- #milestone timeline slide
- #project timeline table PPT
- #business execution schedule slide
- #how to create a milestone chart in PowerPoint
About the Product
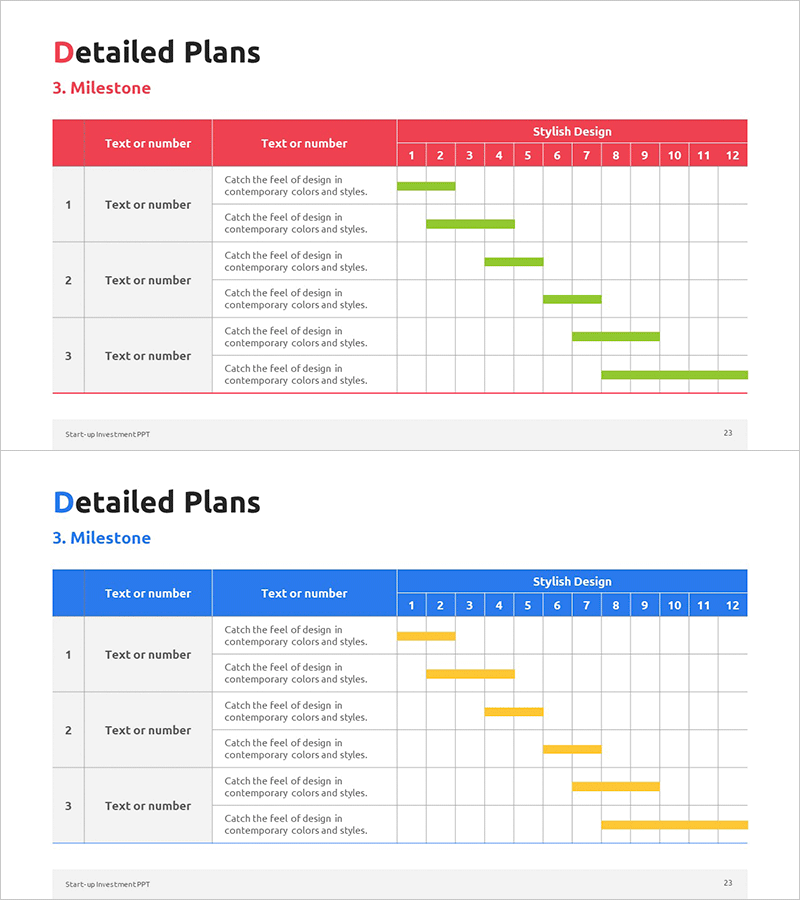
A milestone table PowerPoint slide that visualizes key project timelines and business execution strategies. The slide features 3 rows for milestone entries and 12 monthly timeline columns, with three color variations (red, blue, green) to match your presentation theme. Each milestone includes a text description area and horizontal bar chart to display project phases, responsible teams, and progress status at a glance. Ready to use in business plans, operational plans, and project management presentations.
Usage Points
-
Main Usage
Clearly communicate project milestones and execution timelines in tabular format. The combination of descriptive text and timeline bar charts enhances credibility and provides investors, executives, and team members with an intuitive view of business progress and key decision points.
-
How to Use
Insert the milestone table in the 'Execution Strategy' or 'Implementation Plan' section of business plans, investment pitches, or operational presentations. Fill in milestone names, responsible departments, and objectives in each row's text area. Adjust bar lengths to represent estimated durations. Customize colors (red, blue, green) to match your presentation's visual identity.
-
Recommended For
Ideal for executives, business development teams, and project managers presenting execution strategies, operational plans, and project management. Particularly effective for investment pitches and business plans where clear phase-by-phase timelines and decision milestones are critical. The 12-month timeline is optimized for mid-term strategic planning presentations.
-
Slide Structure
The slide uses a 3-row × 12-column layout. The left three columns contain milestone numbers, text input areas, and description text. The right 12 columns display monthly timeline bars. The header row is color-coded, and bar lengths in each milestone row represent project duration.
Related Products
-

Milestone Table Chart Design and Installation Plan
#Business Strategy #Business Management #Operational Plan
-

Automobile Development Business Project Milestones – Efficient Management and Implementation
#Business Strategy #Business Management #Operational Plan
-

Detailed Plan Schedule – Roadmap for Business Strategies
#Business Strategy #Business Management #Operational Plan
-

Project Milestone Table – Business Strategy
#Business Strategy #Business Management #Operational Plan
