Project Year-by-Year Plan Table – Systematic Business Strategy
RM0500009_22
- Last Update 02/22/2025
- File Size 0.5MB
- # of Slides 2
- File Format PPTX
- Slide Ratio 16:9
- Color
Keywords
About the Product
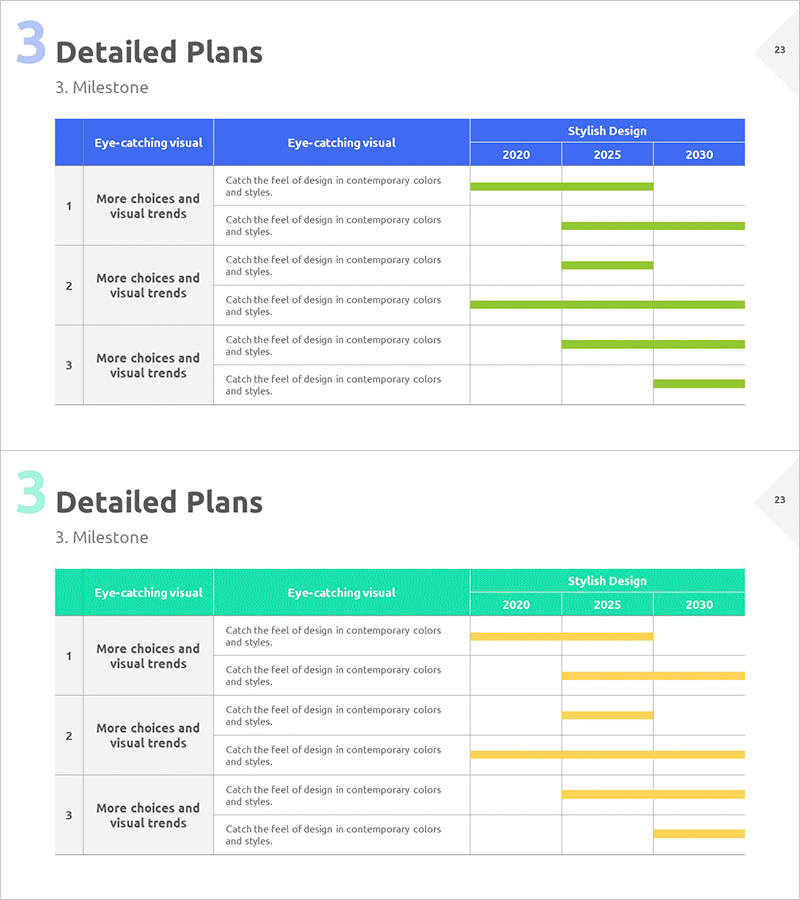
A timeline table slide that visualizes project progress by year. This PowerPoint slide presents a 2024-2030 phased schedule using three distinct colors (blue, green, yellow) to differentiate strategic initiatives. Each row accommodates an initiative title and descriptive text, with horizontal bar charts clearly indicating timeframes. Ideal for business plans, investor pitch decks, and operational strategy presentations to effectively communicate implementation timelines and milestones. Available in 16:9 aspect ratio PPTX format, ready for immediate editing and customization.
Usage Points
-
Main Usage
Visualizes project implementation timelines and milestones in year-by-year format, enabling stakeholders to quickly understand business progress schedules. Color-coded bars by strategic initiative show concurrent activities and priorities at a glance.
-
How to Use
Use in business plans, investor pitch presentations, operational strategy reports, and strategic briefings to explain phased schedules and implementation frameworks. Simply input initiative names and descriptions in text fields, then adjust bar lengths to reflect actual timelines.
-
Recommended For
Suitable for executive presentations, project managers, strategic planning teams, and investor audiences. Particularly effective for explaining medium-to-long-term business plans, new initiative timelines, organizational change management roadmaps, and product development schedules.
-
Slide Structure
Structured in three rows, each containing an initiative title (left), descriptive text (center), and year-by-year timeline bars (right). The 2024-2030 year range is pre-marked, with three color-coded horizontal bars (blue, green, yellow) representing different timeframe periods.
Related Products
-

Construction Project Milestone Table – Systematic Operational Planning
#Business Strategy #Business Management #Operational Plan
-

Project Milestone Table – Business Strategy
#Business Strategy #Business Management #Operational Plan
-

Milestone Table – Essential Tool for Business Strategy
#Business Strategy #Business Management #Operational Plan
-

Mid- to Long-term Project Roadmap and Implementation Plan – Business Strategy
#Business Strategy #Business Management #Operational Plan
