Risk Management After APP Development – Effective Operation Plan
RM0500007_23
- Last Update 10/05/2025
- File Size 3MB
- # of Slides 2
- File Format PPTX
- Slide Ratio 16:9
- Color
Keywords
- #Content-Based Slides
- #Design-Based Slides
- #Operational Plan
- #Diagram
- #Risk Management
- #Post-Implementation Management & Maintenance
- #Cluster
- #Spread
- #Chain Diagram
- #Radial Diagram
- #16:9
- #radial diagram PowerPoint slide
- #risk management presentation
- #3-element flow diagram
- #app development operational plan
- #how to create risk management diagram in PowerPoint
About the Product
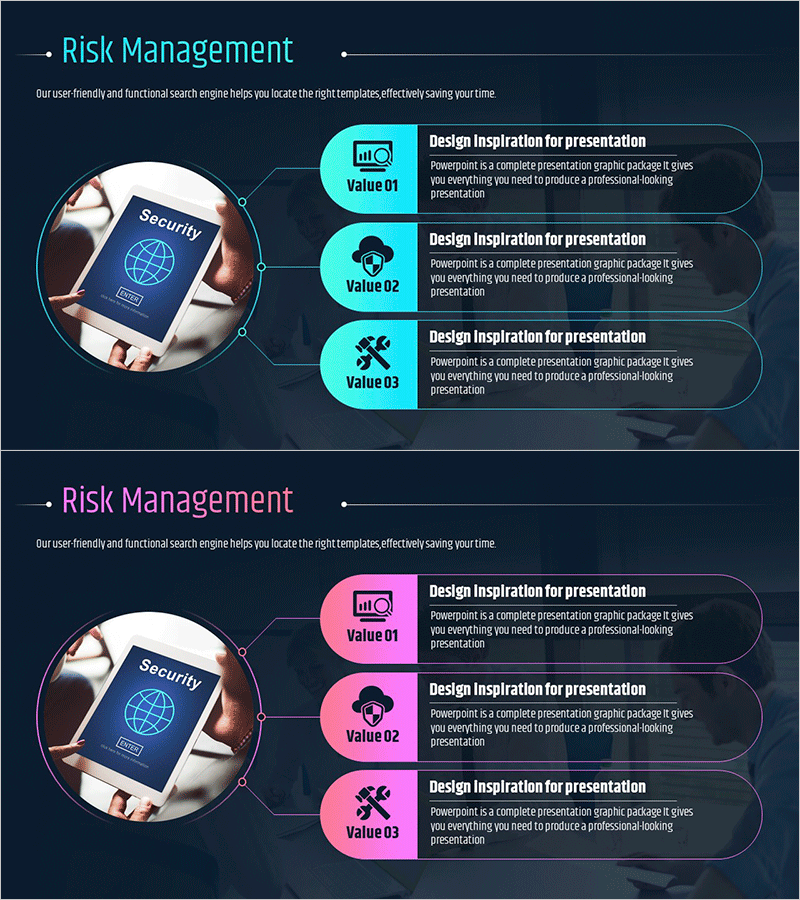
A PowerPoint slide featuring a radial diagram structure that visualizes risk management elements after app development. The design radiates three key risk factors—security, technical support, and operational management—from a central hub, with each element represented by distinct icons and labeled value boxes. The slide uses a dark navy background with two color variations: cyan accent boxes and pink accent boxes, allowing flexibility in presentation context. Delivered in 16:9 widescreen PPTX format with fully editable elements, this slide is ideal for app development completion reports, operational planning presentations, and risk management strategy discussions.
Usage Points
-
Main Usage
This slide systematically categorizes and visualizes risk factors that emerge during the operational phase following app development completion. The radial structure radiates three primary risk management elements—security, technical support, and operational management—from a central hub, effectively communicating both the independence and interconnectedness of each risk factor.
-
How to Use
Use this slide in IT project completion reports, app service operational planning presentations, and risk management strategy meetings to explain key operational management items. Customize the text and icons in each box to match your project context, and select either the cyan or pink color version to align with your presentation theme.
-
Recommended For
Recommended for IT development teams, project managers, operations specialists, and technical leadership roles. Particularly effective when explaining operational plans or sharing risk management frameworks during the completion phase of app and software development projects.
-
Slide Structure
Two-slide set, each featuring a smartphone security image on the left side with three radial value boxes arranged on the right. Each box contains an icon (chart, security, tools), a 'Value 01–03' label, and descriptive text, with connecting lines radiating from the central node to each box. Color variations differ only in the accent box colors: cyan or pink.
Related Products
-

Visualizing Key Automotive Strategy – Cluster and Connection
#Product/Service Introduction #Operational Plan #Diagram
-

Life Tube Diagram for Risk Management Visualization
#Operational Plan #Risk Management and Regulatory Compliance #Diagram
-

Marriage Conflict Diagrams – Effective Solutions
#Operational Plan #Diagram #Risk Management
-

Product Service Overview Connection Diagram – Achieving Success Together
#Product/Service Introduction #Diagram #Product/Service Introduction
