Business Area Analysis Donut Chart – Ideal for Business Overview
RM0500006_5
- Last Update 02/21/2025
- File Size 1.2MB
- # of Slides 2
- File Format PPTX
- Slide Ratio 16:9
- Color
Keywords
- #Content-Based Slides
- #Design-Based Slides
- #Company Introduction
- #Business Introduction
- #Graph
- #Business Areas
- #Business Areas
- #Circles
- #Doughnut Chart
- #16:9
- #donut chart PowerPoint
- #pie chart slide template
- #business area analysis presentation
- #4-section donut diagram
- #market share visualization PowerPoint
About the Product
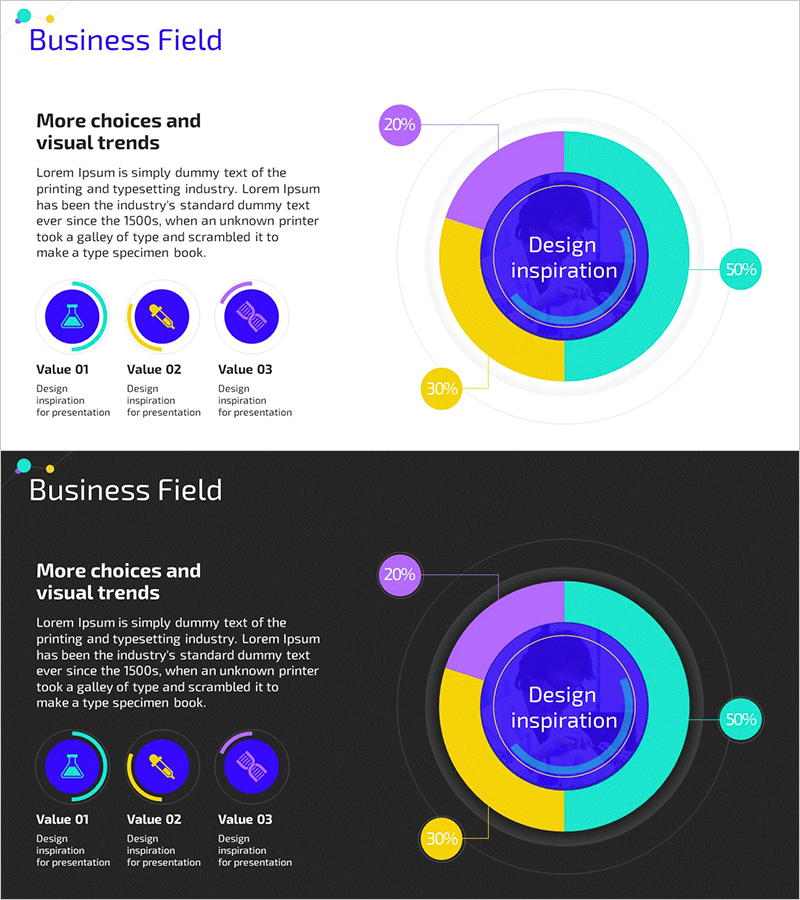
A 4-section donut chart PowerPoint slide designed for business area analysis and market visualization. The central circular area highlights your core message, while the surrounding four segments display proportional data with gradient colors in purple, blue, yellow, and cyan. This presentation template includes two versions: a light background variant for bright environments and a dark background variant for dimly lit spaces. Each segment features percentage labels and connector lines for clear data communication. Ideal for business overview presentations, strategic planning meetings, and investor pitches requiring visual data representation.
Usage Points
-
Main Usage
Visualize business segment proportions, market share distribution, and organizational structure through a 4-section donut chart design. The central circular area draws attention to your key message while the surrounding segments display comparative data. Perfect for presenting business overview, market analysis, revenue breakdown, and strategic initiatives in corporate presentations.
-
How to Use
Edit the percentage values and segment labels to match your business data. Replace the central message with your analysis focus (e.g., 'Design Inspiration', 'Market Share', 'Revenue Distribution'). Customize colors if needed by selecting each segment. Use the light version for bright meeting rooms and the dark version for auditoriums or video presentations.
-
Recommended For
Executive presentations, board meetings, investor pitches, marketing strategy sessions, and business development reports. Suitable for consultants, financial analysts, corporate managers, and entrepreneurs presenting market analysis, business performance, or organizational structure. Works well for quarterly reviews, strategic planning, and competitive analysis presentations.
-
Slide Structure
Two-slide set featuring identical donut chart designs on contrasting backgrounds. Each slide contains a central blue circular area surrounded by four colored segments (purple 20%, cyan 50%, yellow 30%, purple accent). Percentage labels with connector lines are positioned outside each segment for clear data identification and professional appearance.
Related Products
-

Energy Business Area – Business Introduction Diagram
#Company Introduction #Business Introduction #Diagram
-

Communication Business Area Diagram
#Company Introduction #Business Introduction #Diagram
-

Circular Diagram for Company Overview – Visualizing Information through Decentralized Spread
#Company Introduction #Business Introduction #Diagram
-

Diffusion Circular Area Diagram – Highlighting Business Performance
#Company Introduction #Business Introduction #Diagram
