Global Data Analysis Technology Organization Chart – Innovative Technology and Structure
RM0500005_14
- Last Update 02/21/2025
- File Size 0.9MB
- # of Slides 2
- File Format PPTX
- Slide Ratio 16:9
- Color
Keywords
- #Content-Based Slides
- #Design-Based Slides
- #Business Introduction
- #Technical Approach
- #Diagram
- #Technological Status
- #Service Architecture Diagram
- #Structure
- #Tree Diagram
- #16:9
- #radial organization chart PowerPoint
- #tree diagram slide template
- #technology structure diagram
- #hierarchical org chart PPT slide
- #data analysis department PowerPoint template
About the Product
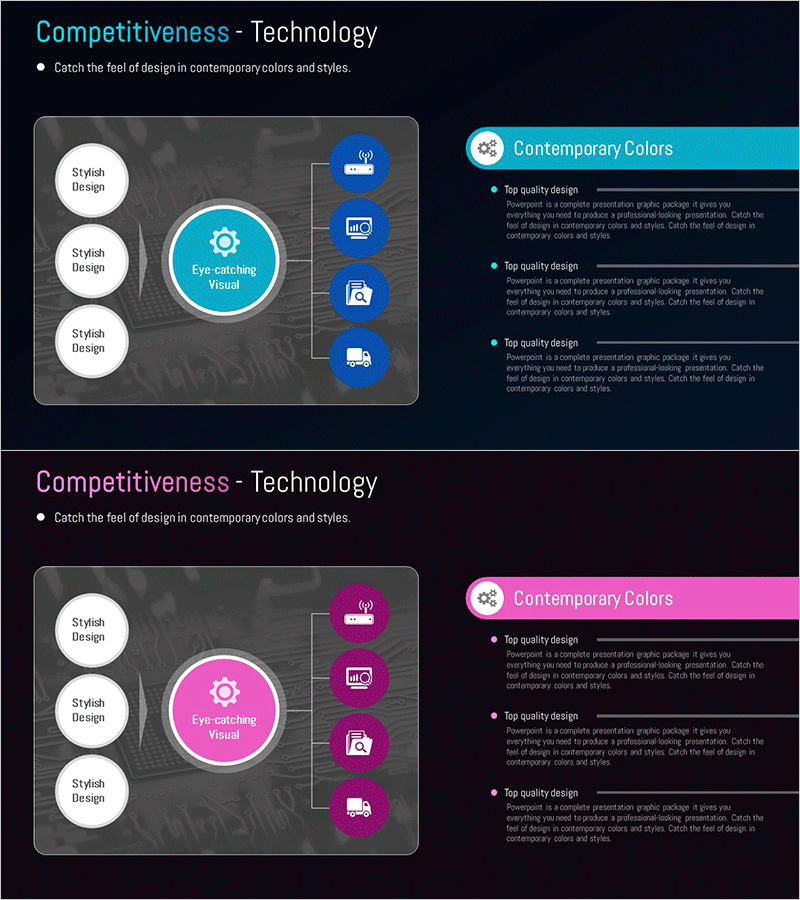
A PowerPoint slide featuring a radial diagram that visualizes your organization's hierarchical structure with a central technology node expanding into four levels. The design uses a dual-tone background in teal and magenta with white circular nodes and blue icon elements, creating a contemporary technology aesthetic. Perfect for presenting data analysis departments, technology divisions, and service architecture. Each node can be customized with department names, roles, or technology components. The slide deck includes two layouts optimized for corporate presentations, investor pitches, and technical team introductions.
Usage Points
-
Main Usage
Visualizes organizational hierarchy through a radial diagram that clearly shows how central technology functions expand outward to surrounding departments and functions. Ideal for presenting organizational structures, technology stacks, and interdepartmental relationships in an intuitive, visually engaging format.
-
How to Use
Use this slide when introducing your technology organization, presenting data analysis team composition, or explaining technical division strategies. Customize each node with department names, team members, or technology components. Replace icons to match your organization's specific focus areas and technical domains.
-
Recommended For
Technology executives, data analysis team leads, IT organization managers, and technical strategy presenters benefit most from this template. Effective for investor presentations, technology partnership meetings, organizational restructuring announcements, and technical capability showcases.
-
Slide Structure
Central circular node (core technology) expands into four hierarchical levels via radial connections. Each level features white circular nodes with blue icon indicators, connected by gray lines showing relationships. Includes three text input areas on the left and an information box on the right, presented as a two-slide customizable set.
Related Products
-

Material Transport Plan Tree Structure – Innovative Business Proposal
#Business Introduction #Technical Approach #Diagram
-

Sustainable Operation System Diagram – Efficiency and Innovation
#Technical Approach #Diagram #Service Architecture Diagram
-

Brown Composition Diagram of the Background of Ingredients – Efficient System Structuring
#Technical Approach #Diagram #Service Architecture Diagram
-

Auto Business Ops Diagram – Efficiency and Innovation
#Technical Approach #Diagram #Service Architecture Diagram
