Introduction of Various Research Areas – Diffusion Explanation of Service Composition Diagram
RB0400018_5
- Last Update 03/12/2025
- File Size 1MB
- # of Slides 2
- File Format PPTX
- Slide Ratio 4:3
- Color
Keywords
- #Content-Based Slides
- #Design-Based Slides
- #Business Introduction
- #Technical Approach
- #Diagram
- #Technological Status
- #Service Architecture Diagram
- #Spread
- #Centralized Diagram
- #4:3
- #radial diagram PowerPoint slide
- #center node presentation template
- #5-item structure diagram
- #service composition PowerPoint
- #how to create radial diagram in PowerPoint
About the Product
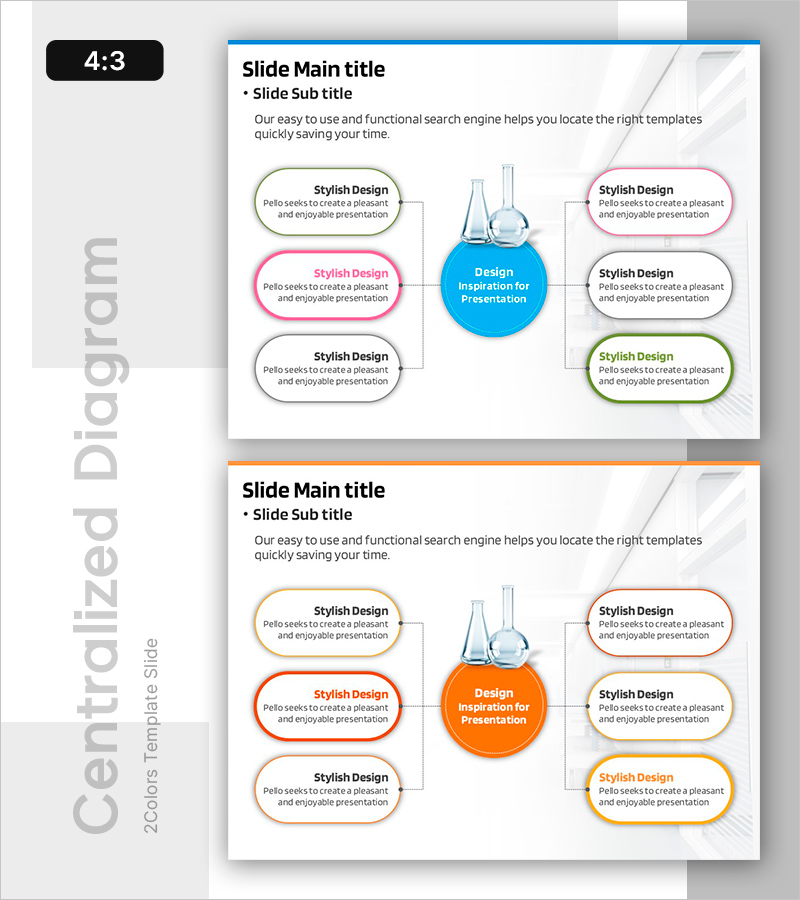
A radial diagram PowerPoint slide featuring a central blue circular node with five directional branches extending outward. Each branch connects to a colored speech bubble text box (pink, gray, green, beige) via dotted lines, creating a clear hierarchical structure ideal for service composition, research field overview, and technology landscape presentations. The 2-slide deck in 4:3 aspect ratio allows full customization of text content for immediate use in business presentations, proposals, and educational materials.
Usage Points
-
Main Usage
Visualizes hierarchical information flowing from a central concept to five surrounding elements. Ideal for presenting service architectures, research domain overviews, technology landscapes, organizational functions, and multi-faceted topic breakdowns in corporate presentations, academic seminars, and strategic planning documents.
-
How to Use
Enter your core concept in the central blue circle and add descriptive text to each of the five surrounding speech bubbles. Use different colors to categorize items or indicate priority levels. The dotted connecting lines emphasize relationships between the center and peripheral elements. Ready to use in business decks, research presentations, and planning materials.
-
Recommended For
Technology companies explaining service architecture, research institutions presenting research domains, consulting firms analyzing solution structures, marketing teams describing product features, educational institutions introducing academic programs, and any presentation requiring hierarchical information visualization with a central focal point.
-
Slide Structure
2-slide presentation in 4:3 format. Each slide features a central blue circular node surrounded by five colored speech bubble text boxes (pink, gray, green, beige) positioned at top, bottom, left, right, and upper-right. Dotted arrow lines connect the center to each peripheral element, creating a balanced radial composition with clear visual hierarchy.
Related Products
-

Sports Infographic Strategy Diagram – Vision and Competitiveness
#Business Introduction #Business Vision and Strategy #Diagram
-

Sustainable Operation System Diagram – Efficiency and Innovation
#Technical Approach #Diagram #Service Architecture Diagram
-

Science Business Area Diffusion Diagram – Connecting the Future of Business
#Company Introduction #Business Introduction #Diagram
-

Core Service Structure Diagram – Exploring Business Areas
#Business Introduction #Technical Approach #Diagram
