Construction Project Milestone Table – Systematic Operational Planning
RM0500004_22
- Last Update 02/20/2025
- File Size 1.4MB
- # of Slides 2
- File Format PPTX
- Slide Ratio 16:9
- Color
Keywords
- #Content-Based Slides
- #Design-Based Slides
- #Business Strategy
- #Business Management
- #Operational Plan
- #Diagram
- #Roadmap
- #Implementation Plan
- #Table
- #16:9
- #milestone PowerPoint slide
- #project timeline chart
- #schedule table slide
- #construction project milestone PPT
- #how to create a project timeline in PowerPoint
About the Product
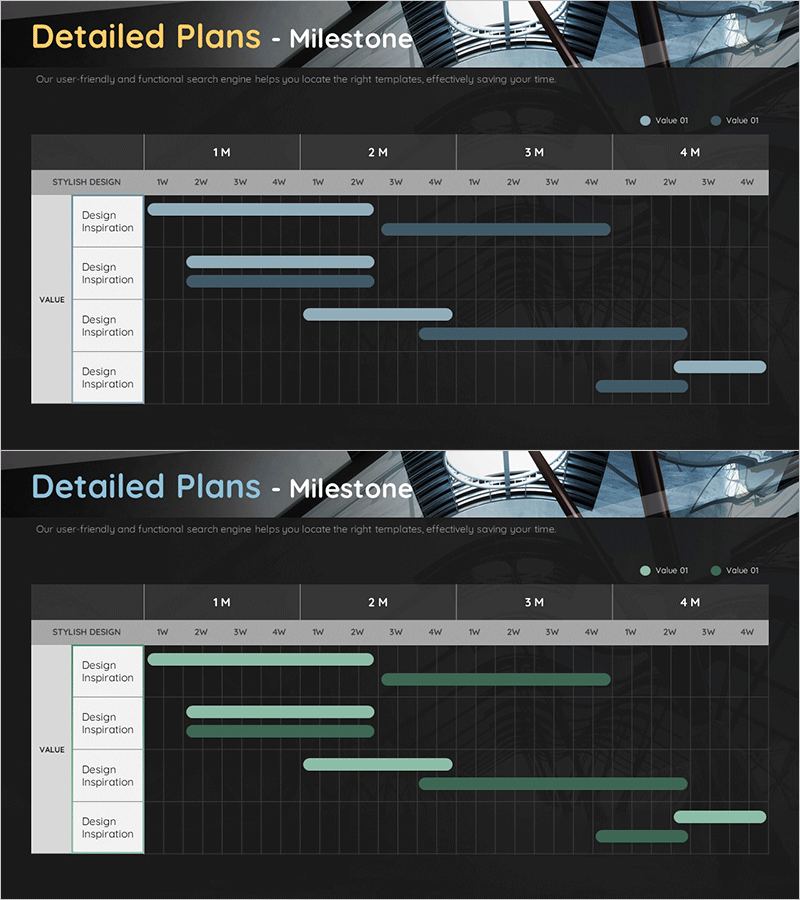
A professional milestone timeline PowerPoint slide optimized for construction and project management presentations. Featuring a dark background with blue and green horizontal bar charts, this slide visualizes a 4-month project schedule broken down by weekly intervals, allowing stakeholders to grasp project progress at a glance. The 2-slide set includes two versions (Value 01 and Value 02) with distinct color schemes, enabling comparative analysis or alternative scenario presentations. Clearly defined text input areas make immediate editing straightforward, and the design applies seamlessly to project planning presentations across construction, IT, manufacturing, and other industries.
Usage Points
-
Main Usage
Clearly communicates project milestones and weekly schedules in timeline format. The dark background grid layout intuitively represents progress over time, demonstrating project schedule reliability to investors, clients, and team members.
-
How to Use
Deploy in the operational planning section of construction, IT, or manufacturing project proposals to present overall schedule overview. Input milestone names, start, and end weeks; the bar lengths adjust automatically. Modify colors to distinguish priority levels or status (in progress, completed, planned).
-
Recommended For
Ideal for construction firms and engineering companies presenting project proposals and business plans; IT and software development companies showcasing product roadmaps; manufacturers explaining new product launch timelines; and consulting firms presenting implementation schedules. Effective for presentations to project managers, client stakeholders, and executive leadership.
-
Slide Structure
Both slides follow identical structure with title area (Detailed Plans - Milestone) at top, month and week headers in the center, and four rows of milestone bar charts at bottom. Each row includes a Design Inspiration text input field. Value 01 uses blue tones while Value 02 uses green tones, enabling comparative analysis across versions.
Related Products
-

Colorful Project Milestones – Visualization of Business Strategies
#Business Strategy #Business Management #Operational Plan
-

Automobile Development Business Project Milestones – Efficient Management and Implementation
#Business Strategy #Business Management #Operational Plan
-

Detailed Plan Schedule – Roadmap for Business Strategies
#Business Strategy #Business Management #Operational Plan
-

Milestone Table Chart Design and Installation Plan
#Business Strategy #Business Management #Operational Plan
