Startup Business Activity Structure Diagram – Efficient Operational Planning
RM0400015_31
- Last Update 02/19/2025
- File Size 0.3MB
- # of Slides 2
- File Format PPTX
- Slide Ratio 16:9
- Color
Keywords
- #Content-Based Slides
- #Design-Based Slides
- #Business Management
- #Operational Plan
- #Technical Approach
- #Diagram
- #Implementation Plan
- #Service Architecture Diagram
- #Structure
- #Tree Diagram
- #16:9
- #tree diagram PowerPoint
- #hierarchical structure slide template
- #3-level organizational chart
- #startup activity structure diagram
- #process flow PowerPoint slide
About the Product
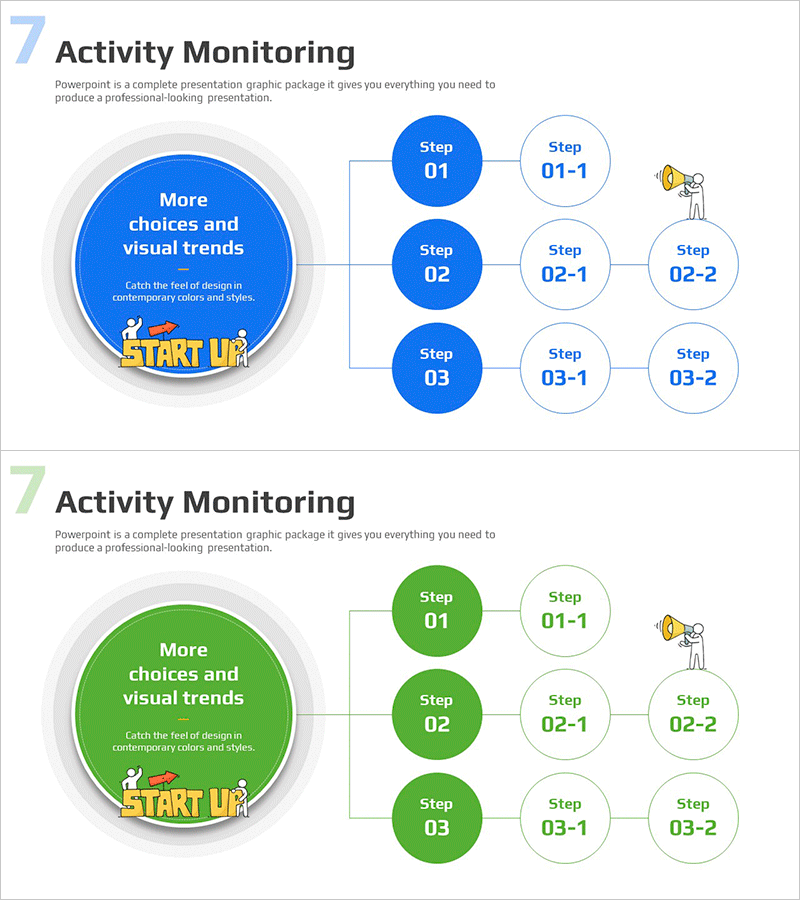
A PowerPoint slide that visualizes startup business activity structure through a 3-level hierarchical tree diagram. The design features a large central circular node branching into three primary steps (Step 01, 02, 03), with each step further expanding into 2-3 sub-items. The color scheme uses blue and white tones with solid connector lines to clearly represent hierarchical relationships. This presentation template is ready to use for operational planning, process flow explanation, and organizational structure presentation.
Usage Points
-
Main Usage
Clearly explains startup or corporate activity structure, organizational hierarchy, and operational processes through a 3-level tree format. Visually communicates logical flow from central concept to stage-by-stage detailed items.
-
How to Use
Insert into organizational structure sections of presentations, operational system explanations in business plans, or activity monitoring portions of company introduction decks. Edit node text to customize with actual department names, stage titles, and specific items.
-
Recommended For
Startup founders, corporate strategy managers, executives explaining organizational changes, business plan presenters, and operational efficiency project leaders. Suitable for investment pitch decks, internal reports, and educational seminar materials.
-
Slide Structure
2-slide set. First slide features a large blue central circular node branching into 3 blue circular nodes (Step 01, 02, 03), with each step expanding into 2-3 white circular sub-nodes. Second slide presents the identical structure in green tones, providing color variation options.
Related Products
-

Milestone Table – Essential Tool for Business Strategy
#Business Strategy #Business Management #Operational Plan
-

Business Trip Planning Slide – Efficient Business Management
#Business Management #Operational Plan #Diagram
-

Health Weight Management Table – Effective Operational Planning Slide
#Business Management #Operational Plan #Diagram
-

Data Solution Strategy Slide – Efficient Technical Solutions
#Operational Plan #Technical Approach #Diagram
