Table of Product Development Analysis by Year – Visual Trends and Style
RM0400015_22
- Last Update 02/19/2025
- File Size 0.3MB
- # of Slides 2
- File Format PPTX
- Slide Ratio 16:9
- Color
Keywords
About the Product
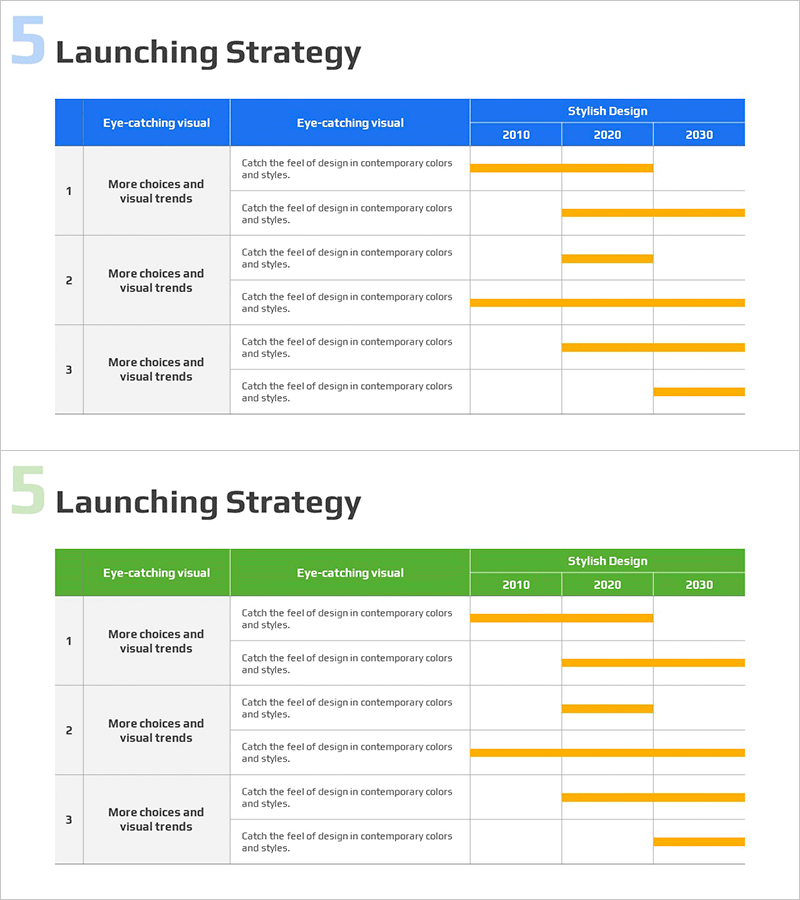
A table diagram PowerPoint slide for comparing and analyzing product development processes across years. Presented in two color versions with blue and green headers, featuring three detailed items per row and horizontal bar charts spanning 2010, 2020, and 2030. This slide combines descriptive text with visual data representation to intuitively convey changes over time during strategic planning phases. The structure is ready for immediate use in presentations and planning documents.
Usage Points
-
Main Usage
Used to compare and analyze product development strategies by year and visually represent progress at each stage. The table format systematically organizes information while horizontal bar charts simultaneously convey temporal trends and changes.
-
How to Use
Apply this slide in the strategic planning section of business plans, product development reports, and marketing proposals. Enter product names, development objectives, and key characteristics in each row's text area, then adjust bar lengths to represent year-over-year progress. Select the color version that matches your document's tone.
-
Recommended For
Recommended for product managers, marketing professionals, business strategy teams, and executives preparing reports. Ideal for new product development timelines, technology roadmaps, market entry plans, and other comparative analyses with temporal dimensions.
-
Slide Structure
A 3-row × 3-column table layout with row numbers and category names on the left, descriptive text in the center, and horizontal bar charts for 2010, 2020, and 2030 on the right. Two versions provided with blue and green headers; each cell is independently editable.
Related Products
-

Global Service Characteristics Diagram – Effective Product Presentation
#Product/Service Introduction #Diagram #Product/Service Introduction
-

Diffusion Diagram of Business Objectives by Sector
#Business Introduction #Business Vision and Strategy #Diagram
-

Implementation Plan for Data Research – Project Management and Success Strategy
#Business Strategy #Business Management #Diagram
-

Structure Template - Effective Market and Competitor Analysis Using Diagram3
#Operational Plan #Market and Competitor Analysis #Diagram
