Project Funding Report Table – Effective Fund Management
RM0400014_27
- Last Update 02/19/2025
- File Size 0.2MB
- # of Slides 2
- File Format PPTX
- Slide Ratio 16:9
- Color
Keywords
About the Product
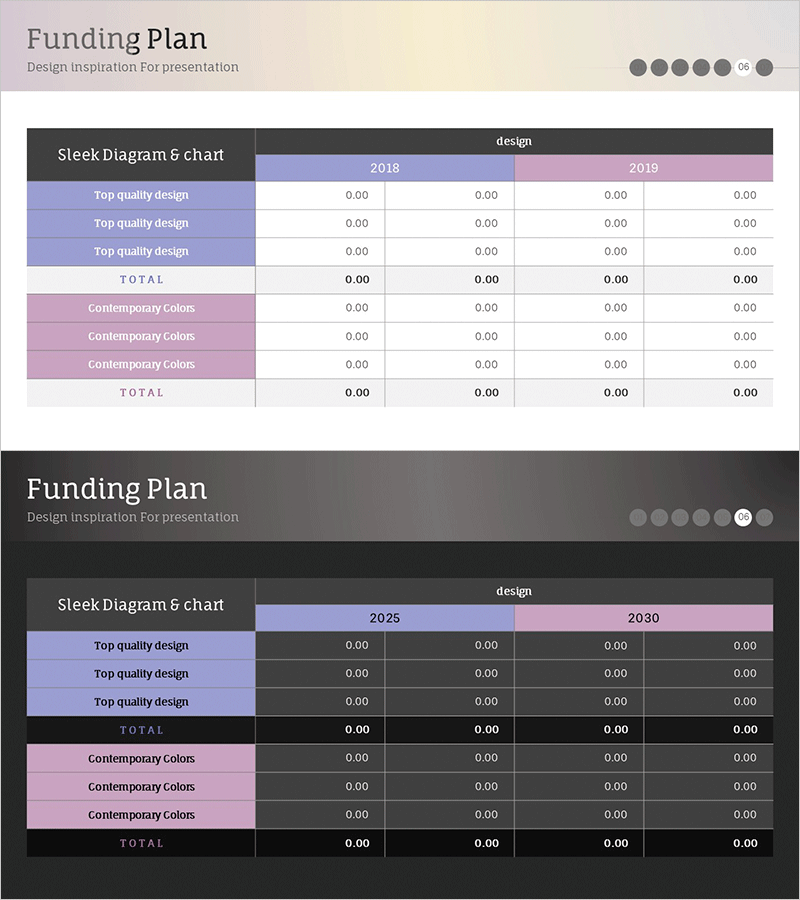
A table diagram PowerPoint slide designed to systematically organize project funding allocation and budget distribution. This presentation template features a two-row table structure with lavender blue and pink dual-tone color scheme, allowing you to input financial data across multiple years and categories. The slide enables clear comparison and analysis of funding plans, budget allocation, and cost trends at a glance. Available in 16:9 widescreen PPTX format with fully editable cells, this slide is ideal for investment presentations, financial reports, budget reviews, and project funding proposals.
Usage Points
-
Main Usage
Organize and visualize project funding plans and budget allocation across multiple years and categories in a structured table format. Enables stakeholders to compare funding amounts and track financial trends efficiently.
-
How to Use
Insert this slide into investment pitch decks, financial reports, and project proposals in the funding section. Enter numerical data into each cell, customize colors and fonts to match corporate branding, and adjust column headers for specific fiscal periods.
-
Recommended For
CFOs, financial managers, project managers, investment officers, and business development professionals presenting funding strategies. Suitable for startup fundraising pitches, large-scale project budget presentations, and quarterly financial review meetings.
-
Slide Structure
Header area with category labels, two-row table with lavender blue and pink backgrounds, year-based columns (2018, 2019, 2025, 2030), and subtotal/total rows. All cells are editable for numerical input and formula integration.
Related Products
-

PowerPoint Template for Service Operation Strategy Presentation
#Business Management #Operational Plan #Technical Approach
-

Step-by-Step Pricing Strategy Presentation Slide
#Business Strategy #Marketing Plan and Strategy #Diagram
-

Idea Presentation Template Wide – Dynamic Business Strategy
#Product/Service Introduction #Business Vision and Strategy #Diagram
-

Introducing Differentiated Product Services – Infographic Slide to Enhance Business Efficiency
#Product/Service Introduction #Diagram #Product/Service Introduction
