Cluster Diagram Slide Visualizing Vision – Strategies & Goals
RM0800005_6
- Last Update 10/03/2025
- File Size 10.8MB
- # of Slides 2
- File Format PPTX
- Slide Ratio 16:9
- Color
Keywords
- #Content-Based Slides
- #Design-Based Slides
- #Company Introduction
- #Business Vision and Strategy
- #Diagram
- #Core Values, Vision, and Mission
- #Business Vision
- #Cluster
- #Inclusive Cluster Diagram
- #Chain Diagram
- #16:9
- #cluster diagram PowerPoint
- #vision visualization slide
- #strategy connection diagram
- #radial diagram template
- #business strategy PPT slide
About the Product
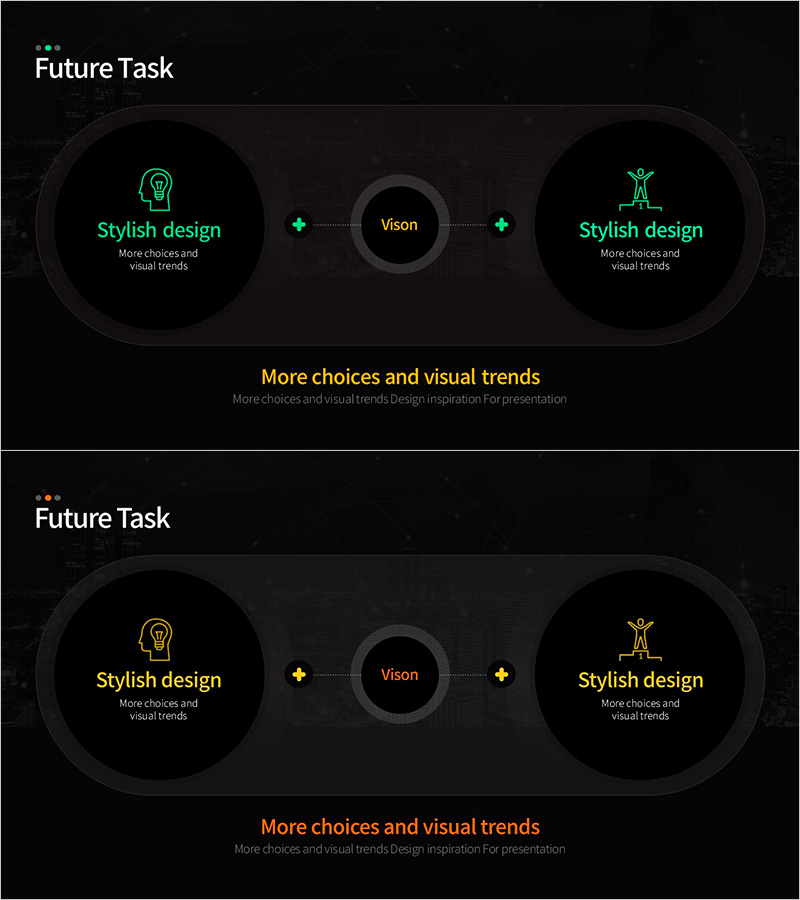
A 2-node cluster diagram PowerPoint slide that radiates from a central vision element to left and right strategy and goal nodes. Featuring a dark background with neon green icons and an orange central circle for emphasis, this slide intuitively expresses the relationship between strategies and objectives. Optimized for executive presentations, strategic direction briefings, and organizational goal-setting sessions. The 16:9 PPTX format allows immediate editing, with fully customizable text and color schemes to match your corporate branding and presentation context.
Usage Points
-
Main Usage
Positions organizational core vision at the center and connects it to left and right strategy and goal nodes, enabling stakeholders to grasp leadership direction and execution strategy at a glance. Ideal for executive briefings, strategic planning sessions, and business direction presentations.
-
How to Use
Enter core vision in the central circle, strategic direction in the left node, and specific goals in the right node. Use arrows and connecting lines to express cause-and-effect relationships. Customize node text and icons to reflect your organization's characteristics and messaging.
-
Recommended For
Executive and C-suite strategy presentations, organizational development vision-sharing sessions, business planning team goal-setting meetings, consulting firm strategic proposals, and startup investor pitch decks.
-
Slide Structure
Composed of three nodes on a dark background: a central orange circle (vision area), a left neon green icon circle (strategy), and a right neon green icon circle (goals). Connected by dotted directional arrows from center to both sides, with text input areas below each node for customization.
Related Products
-

Colorless Core Competency Diagram – Strategic Connection for Business Vision
#Business Vision and Strategy #Diagram #Business Vision
-

Vision & Goal Square Inclusion Diagram – Strategic Business Vision Representation
#Company Introduction #Business Vision and Strategy #Diagram
-

Startup Company Core Values, Vision and Mission Slide
#Company Introduction #Business Vision and Strategy #Diagram
-

Brand Mission and Goals Execution Plan Diagram – Foundation for Vision Realization
#Company Introduction #Business Vision and Strategy #Diagram
