Consumer Response Analysis and Improvement Strategies – Insight Driven by Data
RM0400009_24
- Last Update 02/17/2025
- File Size 1.1MB
- # of Slides 2
- File Format PPTX
- Slide Ratio 16:9
- Color
Keywords
- #Content-Based Slides
- #Design-Based Slides
- #Technical Approach
- #Marketing Plan and Strategy
- #Diagram
- #Service Architecture Diagram
- #Marketing Strategy
- #Cluster
- #Closed Cluster Diagram
- #16:9
- #closed-loop diagram PowerPoint
- #circular flow slide template
- #service strategy diagram
- #marketing analysis PPT
- #data visualization slide
About the Product
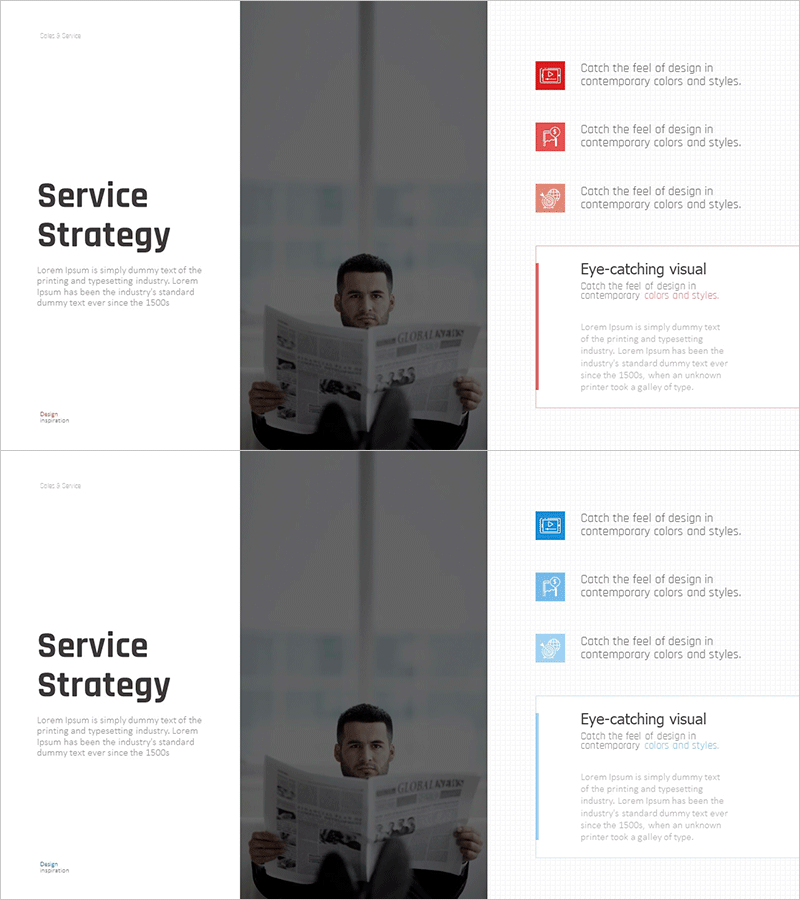
A closed-loop diagram PowerPoint slide that visualizes consumer response analysis and service improvement strategies. The design features a three-node circular structure connected by flow arrows, representing data-driven insight progression. The two-column layout combines a left image area with right-side text and icon elements, delivering both visual impact and clear information hierarchy. A dual-tone color system in red and blue distinguishes each stage, while icons reinforce category recognition. This presentation slide is ready to use for marketing strategy pitches, service architecture presentations, and improvement strategy reports.
Usage Points
-
Main Usage
Optimized for explaining consumer response analysis results and corresponding service improvement strategies in sequential stages. The closed-loop circular structure intuitively represents the analysis-improvement-reassessment cycle, while the left image and right text combination clearly communicates data-driven decision-making processes.
-
How to Use
Use this slide in marketing strategy presentations, service improvement proposals, and customer satisfaction enhancement reports to explain current situations and improvement directions. Customize each node's text and icons to match your content, and insert relevant photos or charts in the left image area for personalization.
-
Recommended For
Ideal for marketing managers, product planning teams, service operations departments, and executives presenting business reports. Perfect for any presentation requiring visual communication of consumer insight-based strategy development, service improvement processes, and data-driven decision-making frameworks.
-
Slide Structure
Two-slide set in 16:9 widescreen format. Each slide divides into 50% left image area and 50% right content area. The right side features three closed-loop nodes in red, pink, and blue with corresponding description text and icons. Circular arrows connect the nodes to emphasize process flow and continuous improvement cycle.
Related Products
-

Service Strategy Circular Diagram – Integrated Data Visualization
#Technical Approach #Marketing Plan and Strategy #Diagram
-

Setting Strategic Marketing Service Goals – Service Strategy
#Technical Approach #Marketing Plan and Strategy #Diagram
-

Experimental Core Competency Diagram – Establishing Effective Marketing Strategies
#Business Vision and Strategy #Marketing Plan and Strategy #Diagram
-

Carbon-neutral Service Construction Plan Triangle – Environmental Protection and Innovation
#Technical Approach #Corporate Social Responsibility #Diagram
